
Mortgage Rates Are High—So Why Did New-Home Sales Jump 6.4%?
Mortgage rates are high. Housing affordability is still strained. Existing-home sales fell in August.
So why did Americans suddenly sign more contracts for newly built homes?
The U.S. Census Bureau and Department of Housing and Urban Development reported on September 24 that new single-family home sales reached a seasonally adjusted annual rate of 684,000 in August, up 6.4% from July’s revised pace of 643,000. Sales were still 2.0% below August 2025. (U.S. Census Bureau)
At first, that looks like a contradiction.
But there are two details that change the story.
First, the 6.4% figure describes August contracts, not homes bought at mortgage rates available on September 24. Freddie Mac’s 30-year fixed mortgage averaged roughly 6.65% to 6.69% during August. By September 24, the weekly average had climbed to 7.03%. (Freddie Mac · Freddie Mac rate archive)
Second, builders have tools that many ordinary home sellers do not use at the same scale. They can reduce prices, help with closing costs, or offer financing incentives such as mortgage-rate buydowns that lower a buyer’s effective borrowing cost. (Realtor.com)
In August, 35% of builders reported cutting prices, with an average reduction of 6%, while 63% said they were using sales incentives. (NAHB)

That does not mean the housing market suddenly became strong.
It means the new-home market has become a good example of how price, financing and timing can matter almost as much as the headline mortgage rate.
What Actually Jumped in August?
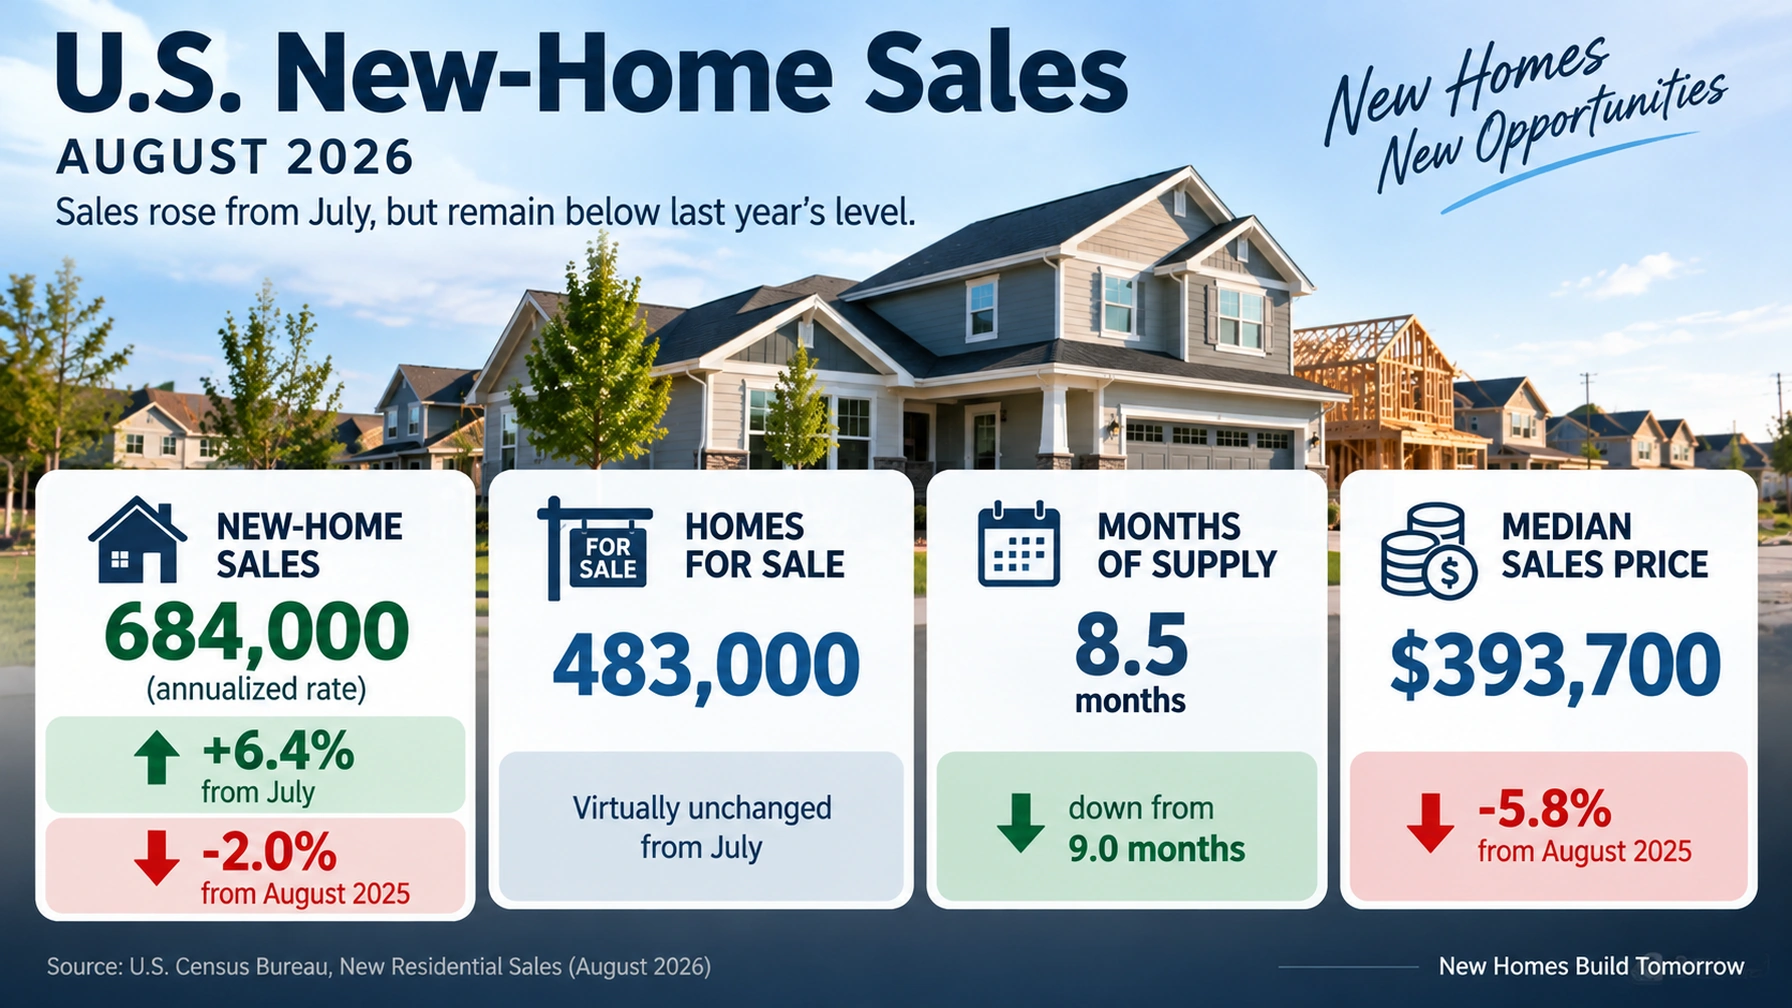
The headline number is an annualized sales rate, not a count of 684,000 homes physically sold in one month.
The Census Bureau adjusts the August activity for normal seasonal patterns and expresses it as the yearly pace that would result if that month’s rate continued.
| August 2026 measure | Result | Comparison |
|---|---|---|
| New single-family home sales | 684,000 annualized | +6.4% from July |
| Change from August 2025 | — | -2.0% |
| New homes for sale | 483,000 | Virtually unchanged from July |
| Months of supply | 8.5 months | Down from 9.0 months |
| Median sales price | $393,700 | -5.8% from a year earlier |
That combination matters.
Sales improved, but the market was not suddenly running out of homes. An 8.5-month supply is still substantial, and the median price remained well below its year-earlier level.
So the August numbers look less like a classic housing boom and more like builders finding enough buyers to move more inventory in a difficult affordability environment.
Why Didn’t High Mortgage Rates Kill the Rebound?
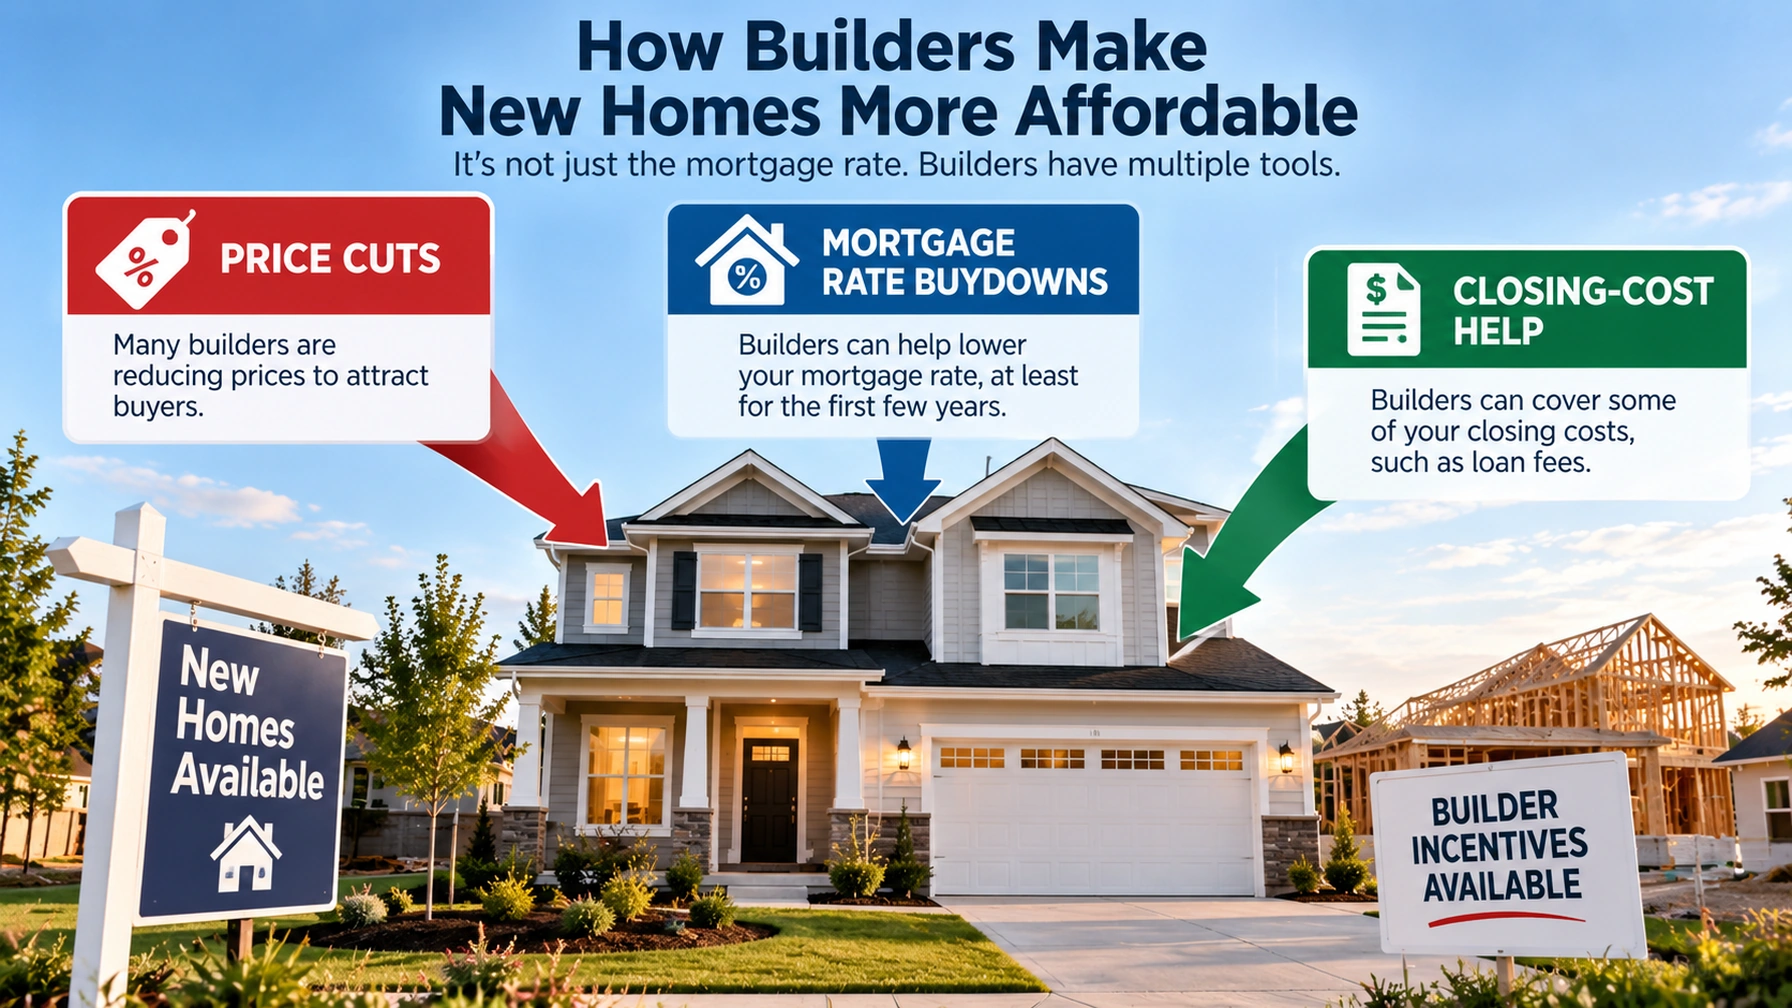
Because the mortgage rate is only one part of what determines whether a buyer can afford a new house.
A builder can attack the affordability problem from several directions.
One option is a straightforward price reduction. Another is paying some of the buyer’s closing costs. Builders can also help subsidize mortgage financing, including through rate buydowns.
That last tool can be especially powerful because many buyers shop around a monthly payment rather than thinking only about the sale price.
Think of the home price and financing package as two separate levers. A builder may leave one relatively unchanged while making the other more attractive.
The August NAHB survey showed how widespread that strategy had become: 63% of builders were using some form of sales incentive, and 35% were cutting prices. Realtor.com has also pointed to mortgage-rate buydowns and other builder deals as an important reason new construction can attract buyers even when conventional mortgage rates remain painful. (NAHB · Realtor.com)
There is an important caveat.
Those incentives are evidence that builders are having to work harder to make sales—not evidence that demand is exceptionally strong.
NAHB’s overall builder-confidence index was only 35 in August, well below the 50 level at which more builders describe conditions as good than poor.
So the sales rebound and weak builder confidence can exist at the same time.
Why Did New Homes Do Better Than Existing Homes?
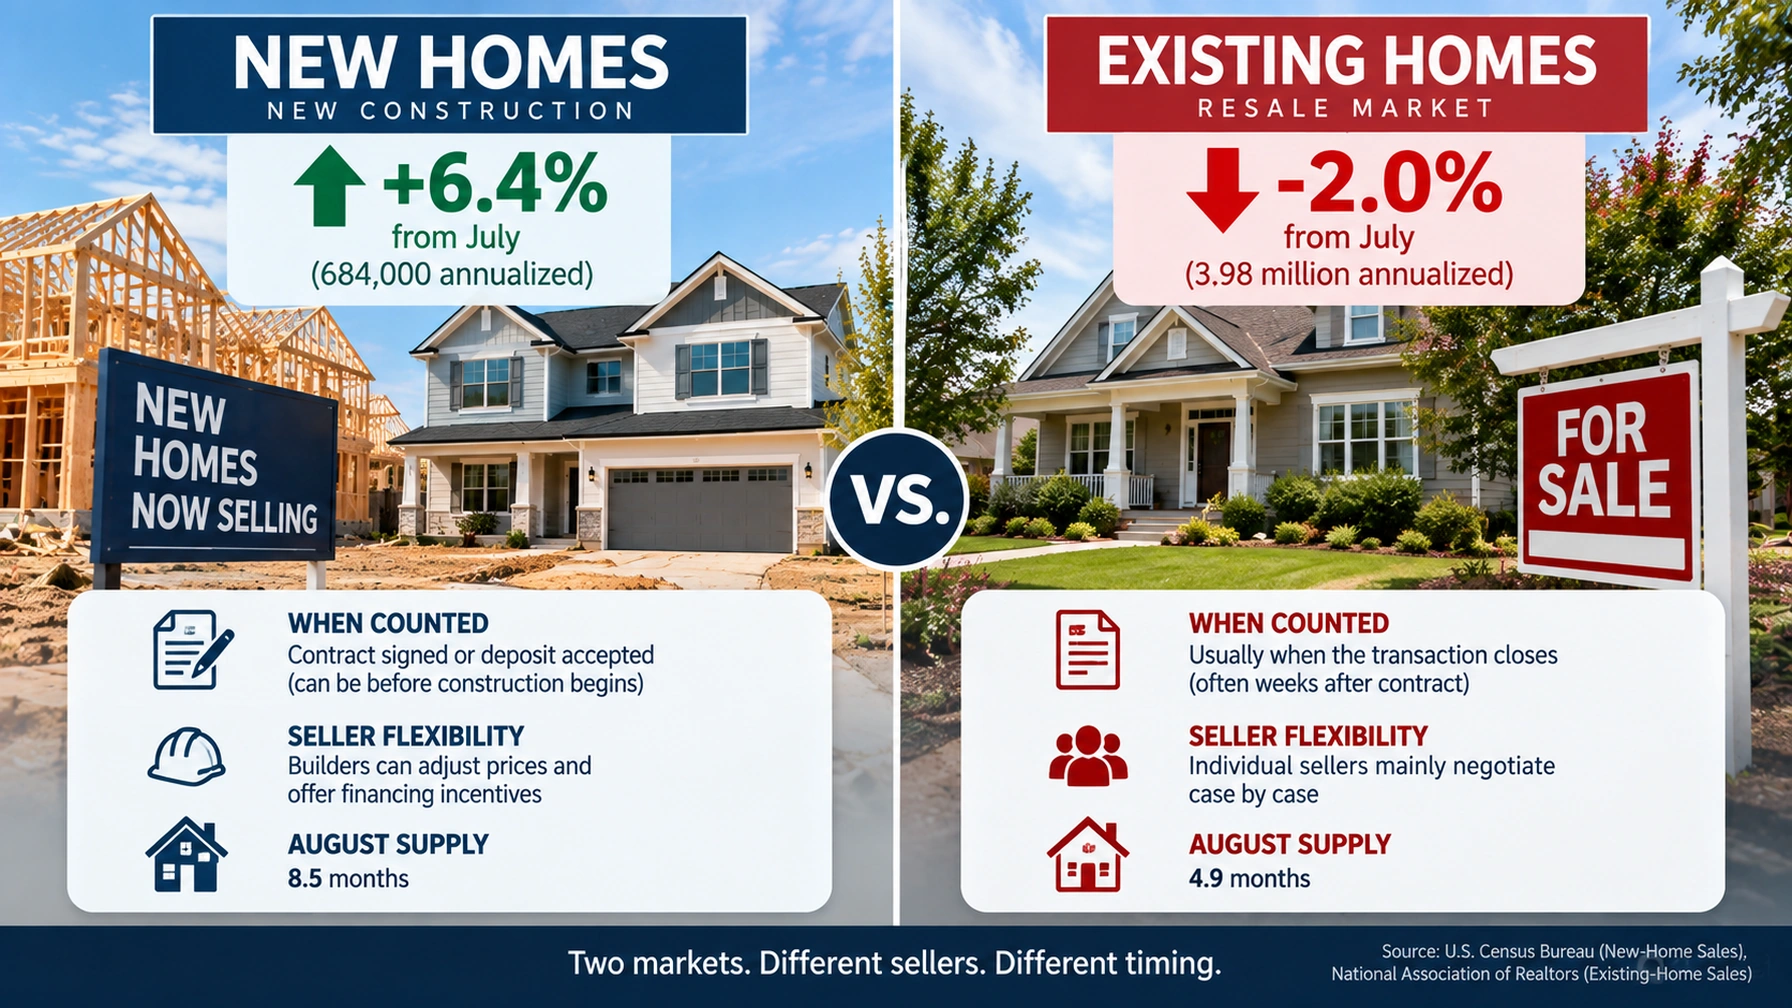
August existing-home sales moved in the opposite direction.
The National Association of Realtors reported that existing-home sales fell 2.0% from July to a 3.98 million annualized pace. Inventory rose to 1.62 million homes, equal to 4.9 months of supply. (National Association of Realtors)
But there is a measurement difference that is easy to miss.
The Census Bureau counts a new house as sold when a buyer signs a sales contract or makes a deposit. The sale can even be recorded before construction begins.
Existing-home sales, by contrast, are generally recorded when the transaction closes—often weeks after the contract is signed. (U.S. Census Bureau definitions · Census comparison of new and existing sales)
That means comparing the two monthly numbers is useful, but they are not perfect mirror images of buyer behavior during the exact same days.
| New-home sales | Existing-home sales | |
|---|---|---|
| August monthly change | +6.4% | -2.0% |
| When generally counted | Contract signed or deposit accepted | Usually when transaction closes |
| August supply | 8.5 months | 4.9 months |
| Seller flexibility | Builders can systematically adjust price and financing incentives | Individual sellers mainly negotiate transaction terms case by case |
There is another difference.
A builder owns inventory as a business. An unsold house ties up land, construction costs and capital.
That gives builders a reason to actively change the offer until a buyer responds.
A homeowner selling one existing property faces a different calculation. That seller can negotiate concessions, but there usually is not an entire development-wide financing program designed to move dozens or hundreds of homes.
That helps explain why new construction can occasionally gain sales even when the broader resale market remains sluggish.
Are New Homes Now Cheaper Than Existing Homes?
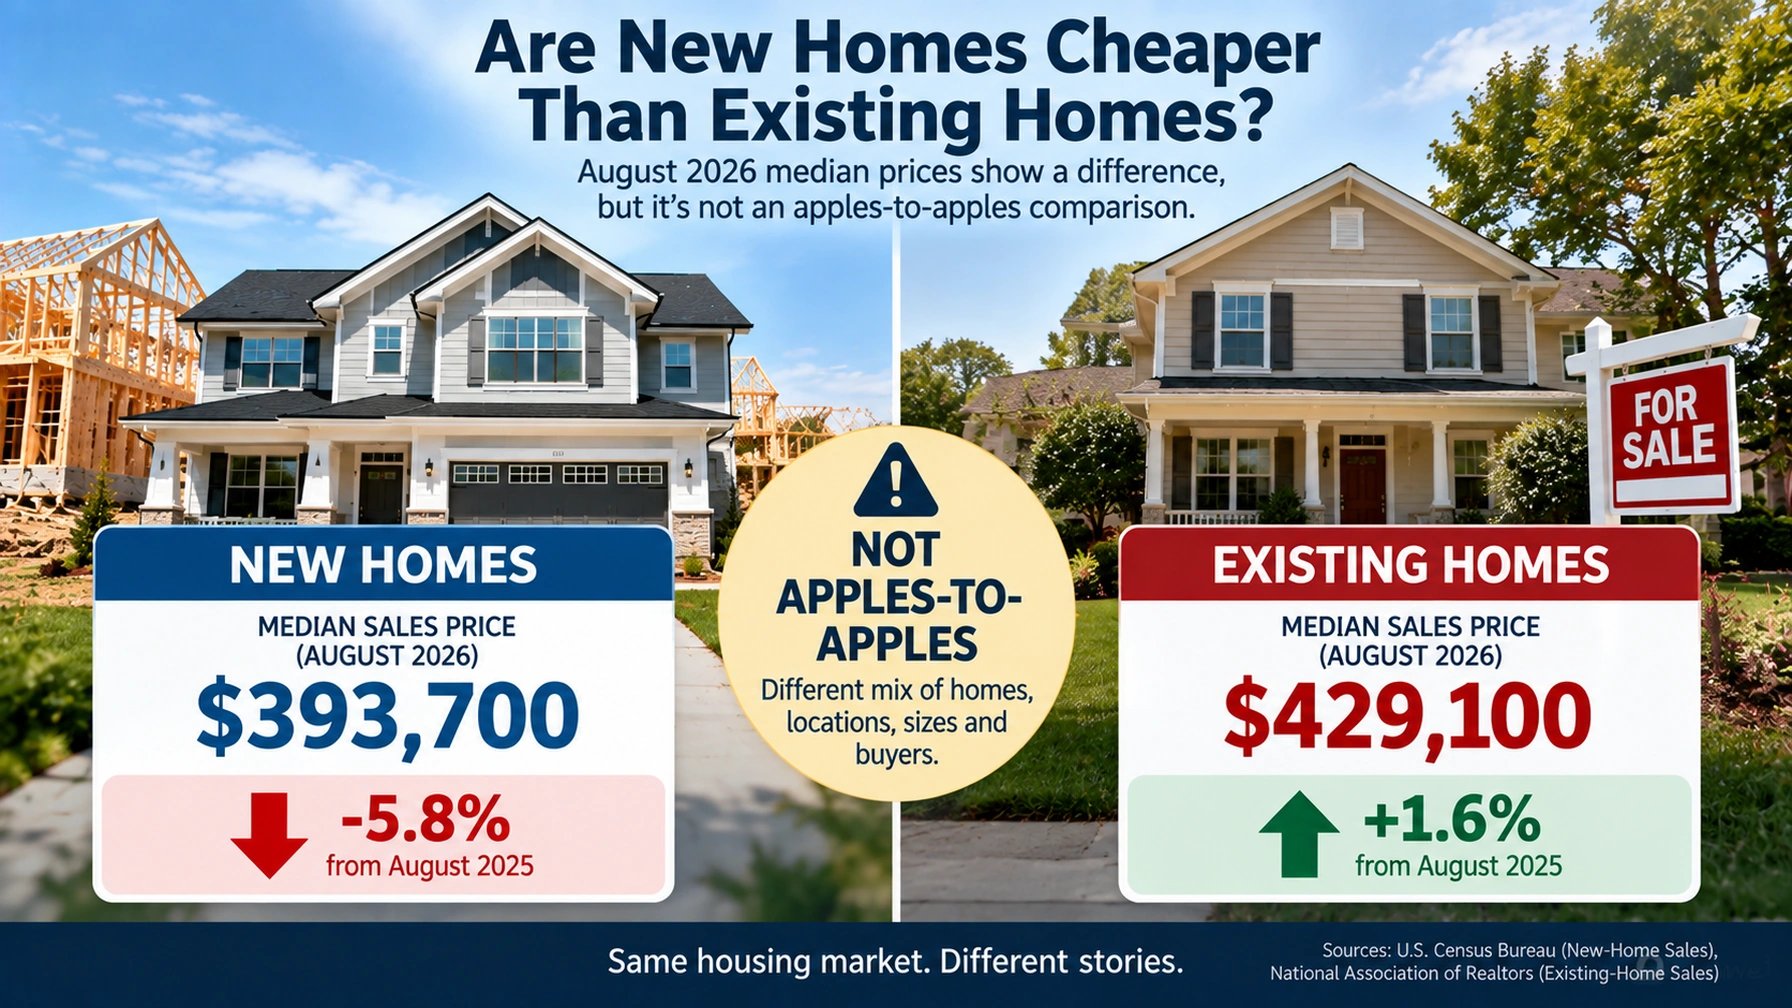
Not necessarily.
But the August medians produced a striking number.
The Census Bureau reported a $393,700 median sale price for newly built homes, down 5.8% from August 2025. NAR reported a $429,100 median for existing homes, up 1.6% from a year earlier. (U.S. Census Bureau · NAR)
That does not mean a comparable brand-new house now costs $35,400 less than a comparable resale house.
The two medians come from different sets of properties, regions, sizes and buyers.
A changing mix of houses sold can push a national median down even if the price of an otherwise identical house did not fall by the same amount.
Still, the direction matters.
Builders have been reducing prices and using incentives in response to affordability pressure. With mortgage costs high, lowering the purchase price or reducing the effective financing cost can make the numbers work for some buyers who otherwise would remain priced out.
That is why the August price data fit with the incentive story.
Builders do not control mortgage markets.
They can control more of the other variables.
Why the 6.4% Headline Needs a Big Asterisk
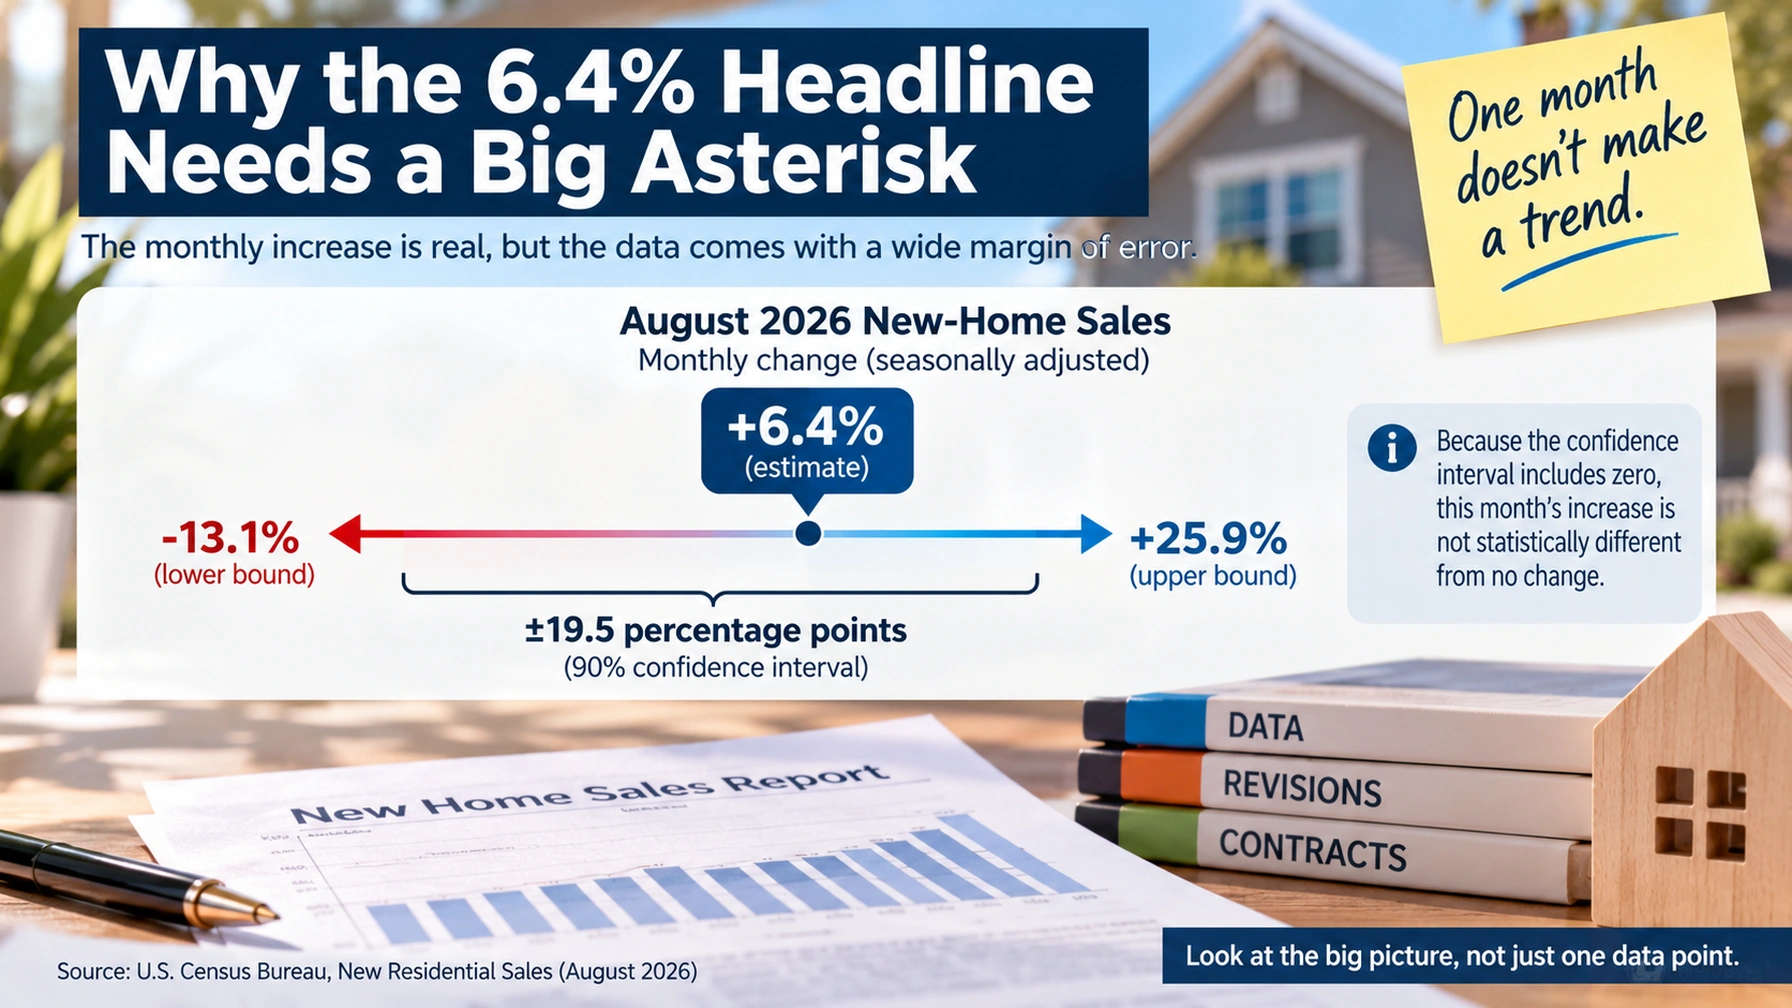
The 6.4% increase is a real Census estimate.
It is not precise enough to prove that new-home demand suddenly entered a strong upward trend.
The Census release puts a ±19.5 percentage-point confidence interval around the monthly change. That range crosses zero.
The Census Bureau states that when a confidence interval includes zero, the reported change is not statistically significant; in other words, the survey does not provide enough evidence to conclude that the true change was definitely positive rather than negative. (U.S. Census Bureau)
That is not unusual for new-home sales.
The survey is based on a sample, monthly estimates can be volatile, and preliminary figures are revised as additional information arrives.
There is another quirk: the Census Bureau stops tracking the sale after the initial contract or deposit is reported. If the transaction is later canceled or never finalized, the house is still counted as sold in the original report. (U.S. Census Bureau definitions)
That does not make the data useless.
It means one monthly jump should be treated as a signal to investigate, not proof that the housing market has turned a corner.
The stronger evidence will come from whether the pattern persists over several reports.
What Should Homebuyers Watch Next?
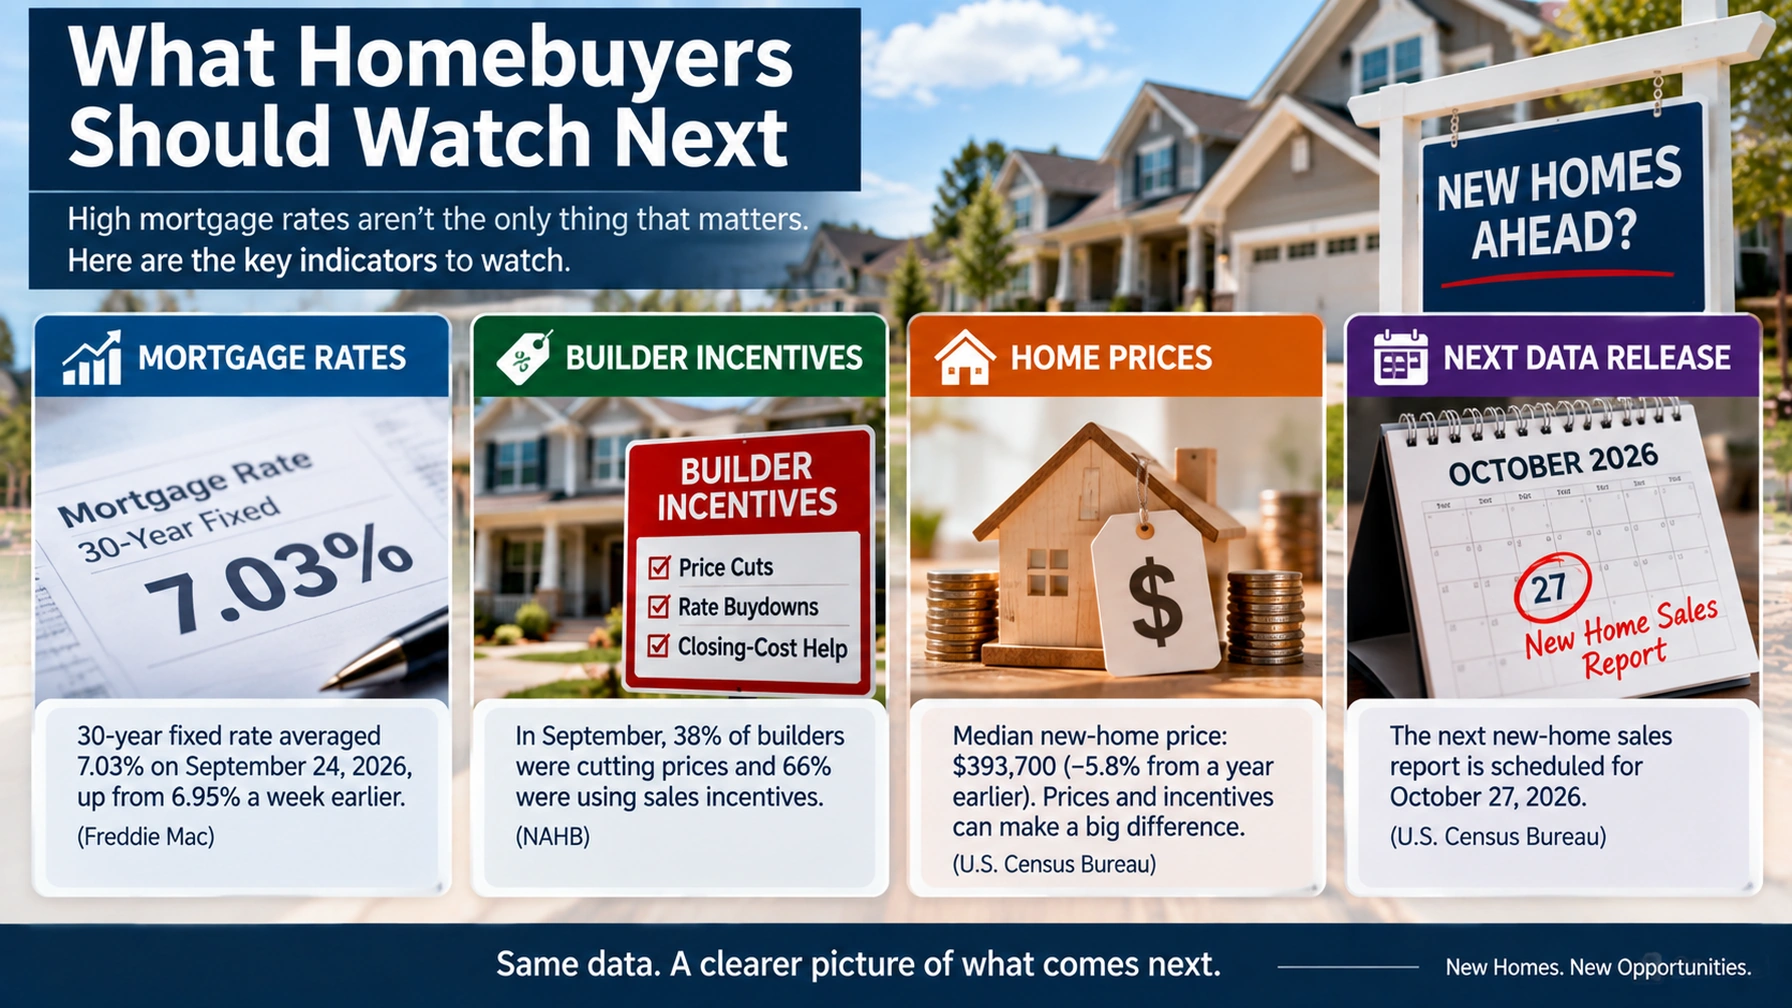
The biggest question now is whether builders can keep compensating for borrowing costs that have risen again.
Freddie Mac reported a 7.03% average 30-year fixed mortgage rate on September 24, up from 6.95% one week earlier and above every weekly August reading. (Freddie Mac)
Builders are responding.
By September, NAHB said 38% of builders were cutting prices and 66% were using sales incentives, both higher than in August. The overall NAHB/Wells Fargo Housing Market Index fell to 32, while the component measuring sales expectations for the next six months dropped to 37. (NAHB)
For buyers, that creates a market where the headline mortgage rate may not tell the whole story.
Three numbers are worth comparing when shopping new construction:
- The actual mortgage rate and APR being offered
- The price of the house after any builder discount
- What incentives require you to use a particular lender or pay other costs
A low promotional rate can be valuable, but it should be evaluated as part of the whole financing package rather than in isolation.
For the broader market, watch whether September sales hold up after mortgage rates moved back above 7%.
The Census Bureau is scheduled to release September new-home sales on October 27, 2026. (Census release schedule)
That report should provide a better test of whether August was the beginning of a stronger pattern—or simply one noisy month helped by builder deals.
Why It Matters in One Sentence
New-home sales can rise even when mortgage rates are high because builders can cut prices and subsidize financing, but August’s 6.4% increase is a volatile monthly estimate—not evidence that America’s housing-affordability problem has disappeared.
New-Home Sales: Key Questions Explained
Q. Did U.S. new-home sales really rise 6.4% in August 2026?
Yes. The Census Bureau estimated that new single-family home sales increased 6.4% from July to a seasonally adjusted annual rate of 684,000. Sales were still 2.0% below their August 2025 pace.
Q. Were mortgage rates above 7% when those August buyers signed contracts?
Not according to Freddie Mac’s weekly national averages. The 30-year fixed rate ranged from roughly 6.65% to 6.69% during August. It reached 7.03% on September 24, after the month measured by the sales report.
Q. Why can builders still sell homes when mortgage rates are high?
Builders can adjust more than the house price. They can offer price reductions, help with closing costs or provide mortgage-rate incentives that reduce a buyer’s effective financing cost.
Q. How many builders were offering incentives?
NAHB reported that 63% of builders used sales incentives in August, while 35% cut prices. The average price reduction among builders cutting prices was 6%.
Q. Why did new-home sales rise while existing-home sales fell?
The two markets have different sellers and are measured differently. New-home sales are generally counted when contracts are signed or deposits accepted, while existing-home sales are usually reported at closing.
Q. Are new homes now cheaper than existing homes?
Not necessarily. The August median new-home price was $393,700 versus $429,100 for existing homes, but those figures describe different groups of properties and should not be treated as prices for otherwise identical homes.
Q. Is the 6.4% monthly increase statistically significant?
No. The Census Bureau reported a ±19.5 percentage-point confidence interval around the monthly change, a range that includes zero. That means the single-month estimate does not establish a definitive upward trend.
Q. Does the Census Bureau remove a sale if the buyer later cancels the contract?
Generally, no. Once a new house is reported sold because a contract was signed or a deposit accepted, the survey does not continue checking whether that particular sale was later canceled.
Q. When will the next new-home sales report be released?
The Census Bureau is scheduled to release September 2026 new-home sales on October 27, 2026.
Did this help make the story clearer? 🙂
WIN keeps unpacking the “why” behind the news—clearly and simply!
Sources
August New-Home Sales and Measurement
U.S. Census Bureau — Monthly New Residential Sales, August 2026
U.S. Census Bureau — Survey of Construction Definitions
U.S. Census Bureau — New Home Sales vs. Existing Home Sales
Mortgage Rates and Builder Incentives
Freddie Mac — Primary Mortgage Market Survey
Freddie Mac — Mortgage Market Survey Archive
NAHB — August 2026 Builder Confidence and Incentives
NAHB — September 2026 Builder Confidence and Incentives
Existing-Home Market and Housing Context
National Association of Realtors — August 2026 Existing-Home Sales
Realtor.com — New-Home Sales Rise as Builders Offer Deals on Mortgage Rates
Keep Reading
Why Can Mortgage-Rate Websites Show Different Numbers on the Same Day?
The latest home-sales report makes more sense once you understand why Freddie Mac, lenders and daily rate trackers can all show different mortgage numbers without any of them necessarily being wrong.
Why Are Mortgage Rates Back Above 7%—and Why Does Every Website Show a Different Number?