
Why Are Mortgage Rates Back Above 7%—and Why Does Every Website Show a Different Number?
I checked one site and saw 7.15%. Another showed 7.16%. Freddie Mac’s latest weekly number was still 6.95%.
So which mortgage rate is the real one?
The confusing answer is that all of those numbers can be legitimate because they are not necessarily measuring the same loan, the same borrower, the same time period, or even the same thing. A quoted interest rate and an APR can also look almost identical while representing different costs.
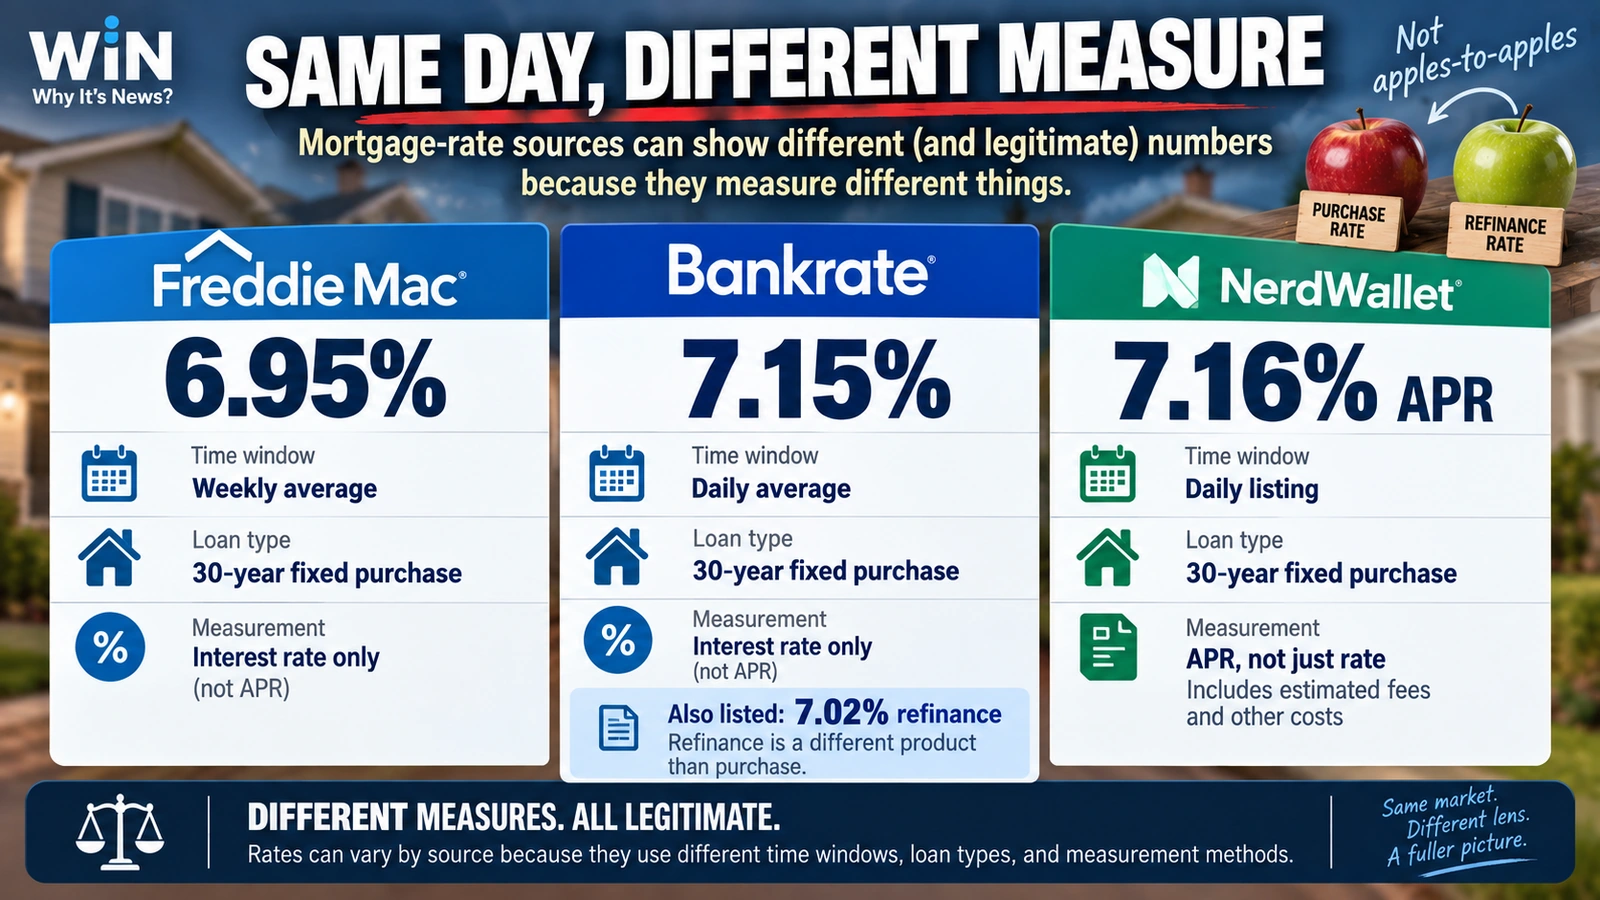
That distinction matters more now because U.S. mortgage rates have moved back toward—and on some daily trackers above—the psychologically important 7% line. On September 22, Bankrate listed a 7.15% national average for a 30-year fixed purchase mortgage, while NerdWallet’s Zillow-supplied data showed a 7.15% interest rate and a 7.16% APR. Freddie Mac’s latest weekly survey, released September 17, showed 6.95%. (Bankrate · NerdWallet · Freddie Mac)

The more useful question is not “Which website is wrong?” It is “What exactly is each number measuring?”
So Which Mortgage Rate Is Actually “Today’s Rate”?
There is no single government-set “national mortgage rate” that every lender must use.
A better way to think about the headline number is as a benchmark produced from a particular set of loans and assumptions. Change the data source, the borrower profile, the loan purpose, the timing, or the treatment of fees, and the average can change.
| Source or figure | Cited reading | What it actually represents |
|---|---|---|
| Freddie Mac PMMS | 6.95% (Sept. 17) | Weekly average of qualifying 30-year fixed purchase applications for conventional conforming loans |
| Bankrate purchase average | 7.15% (Sept. 22) | Daily national average for a 30-year fixed purchase mortgage |
| NerdWallet / Zillow | 7.15% rate, 7.16% APR (Sept. 22) | Daily data in which the interest rate and APR are shown separately |
| Bankrate refinance average | 7.02% (Sept. 22) | A 30-year fixed refinance average, not the same product as a purchase mortgage |
Freddie Mac says its Primary Mortgage Market Survey is built from thousands of mortgage applications submitted through its Loan Product Advisor system. The weekly figure is an average of applications from Thursday through Wednesday and focuses on qualifying conventional, conforming purchase loans. (Freddie Mac · Freddie Mac methodology)
Bankrate, by contrast, publishes daily and weekly averages and separates purchase from refinance products. Its September 22 page showed 7.15% for a 30-year fixed purchase mortgage and 7.02% for a 30-year fixed refinance mortgage. Those two numbers are not contradictory because they describe different loan purposes. (Bankrate purchase rates · Bankrate refinance rates)
NerdWallet’s September 22 data makes another distinction visible: the listed 30-year fixed interest rate was 7.15%, while the APR was 7.16%. APR incorporates certain loan costs beyond the interest rate itself, so it should not automatically be compared with another site’s plain interest-rate number as though they were identical measures. (NerdWallet)
Why Did Mortgage Rates Move Back Toward 7%?
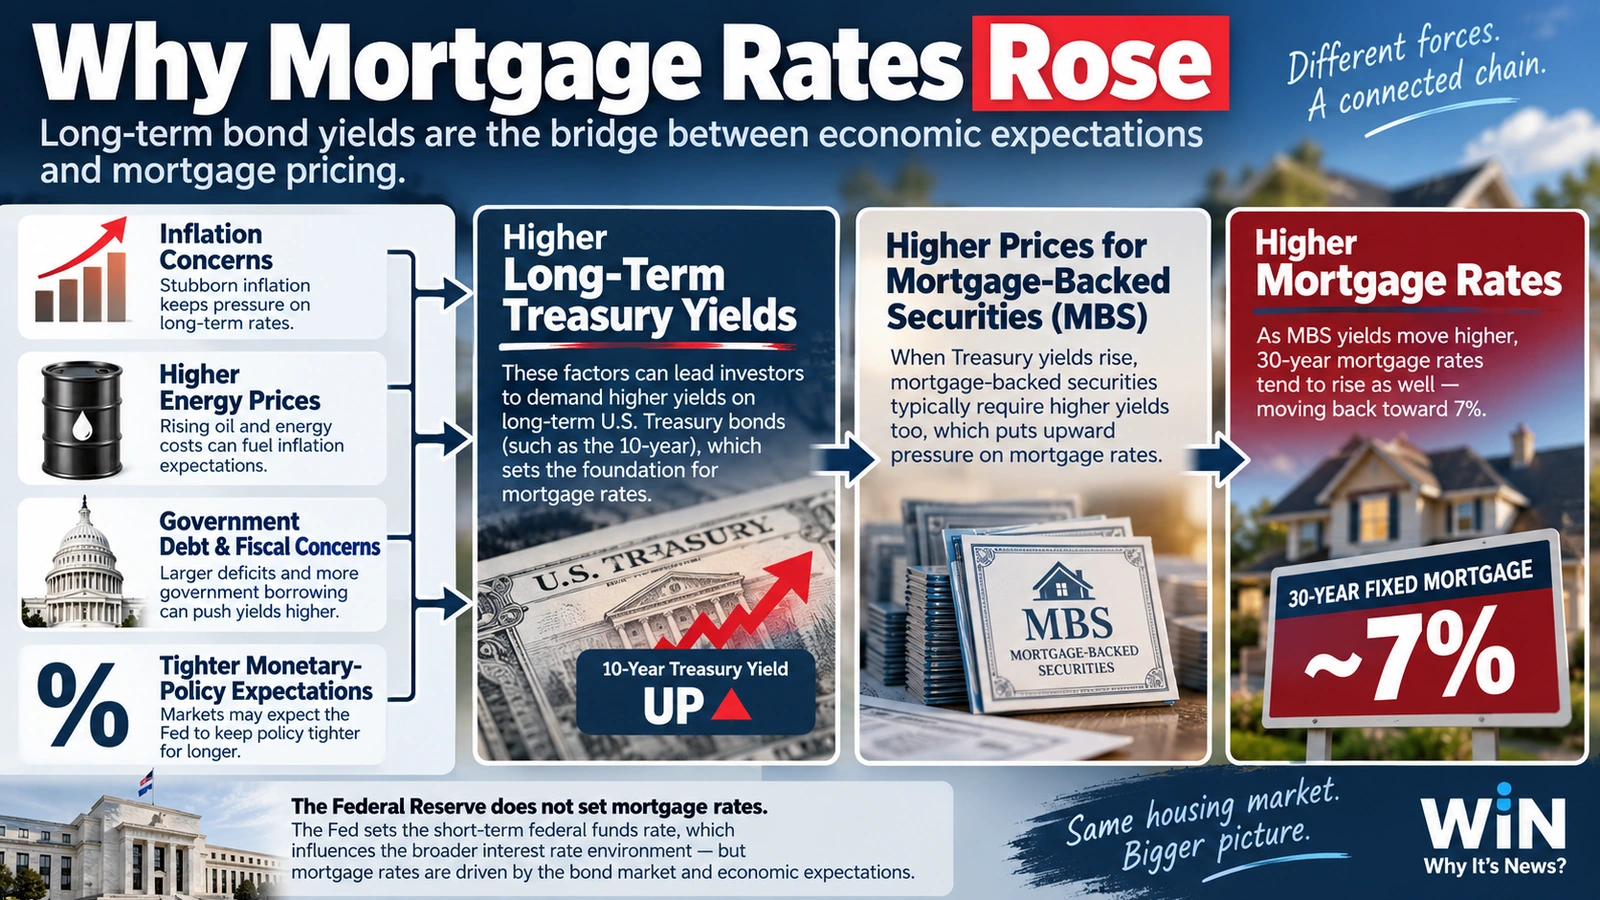
The immediate pressure has come from the long-term bond market.
The 10-year U.S. Treasury yield climbed above 5% in mid-September, reaching 5.041% on September 15 as investors weighed persistent inflation, high energy prices, government debt, and the outlook for tighter monetary policy. Mortgage rates tend to move in the same general direction because mortgage-backed securities compete with Treasury securities for investors’ money. Freddie Mac has long described Treasury yields as an anchor for mortgage-backed-securities pricing, although the spread between Treasury yields and mortgage rates can widen or narrow. (Reuters · Freddie Mac)
That is why a mortgage rate can rise even before the Federal Reserve acts. Bond investors are constantly pricing what they think inflation, growth, government borrowing, and future Fed policy will look like.
By September 22, the 10-year Treasury yield had eased from the previous week’s peak but was still about 4.93% in early U.S. trading, high enough to keep long-term borrowing costs elevated. (Charles Schwab)
Did the Fed Raise Your Mortgage Rate?
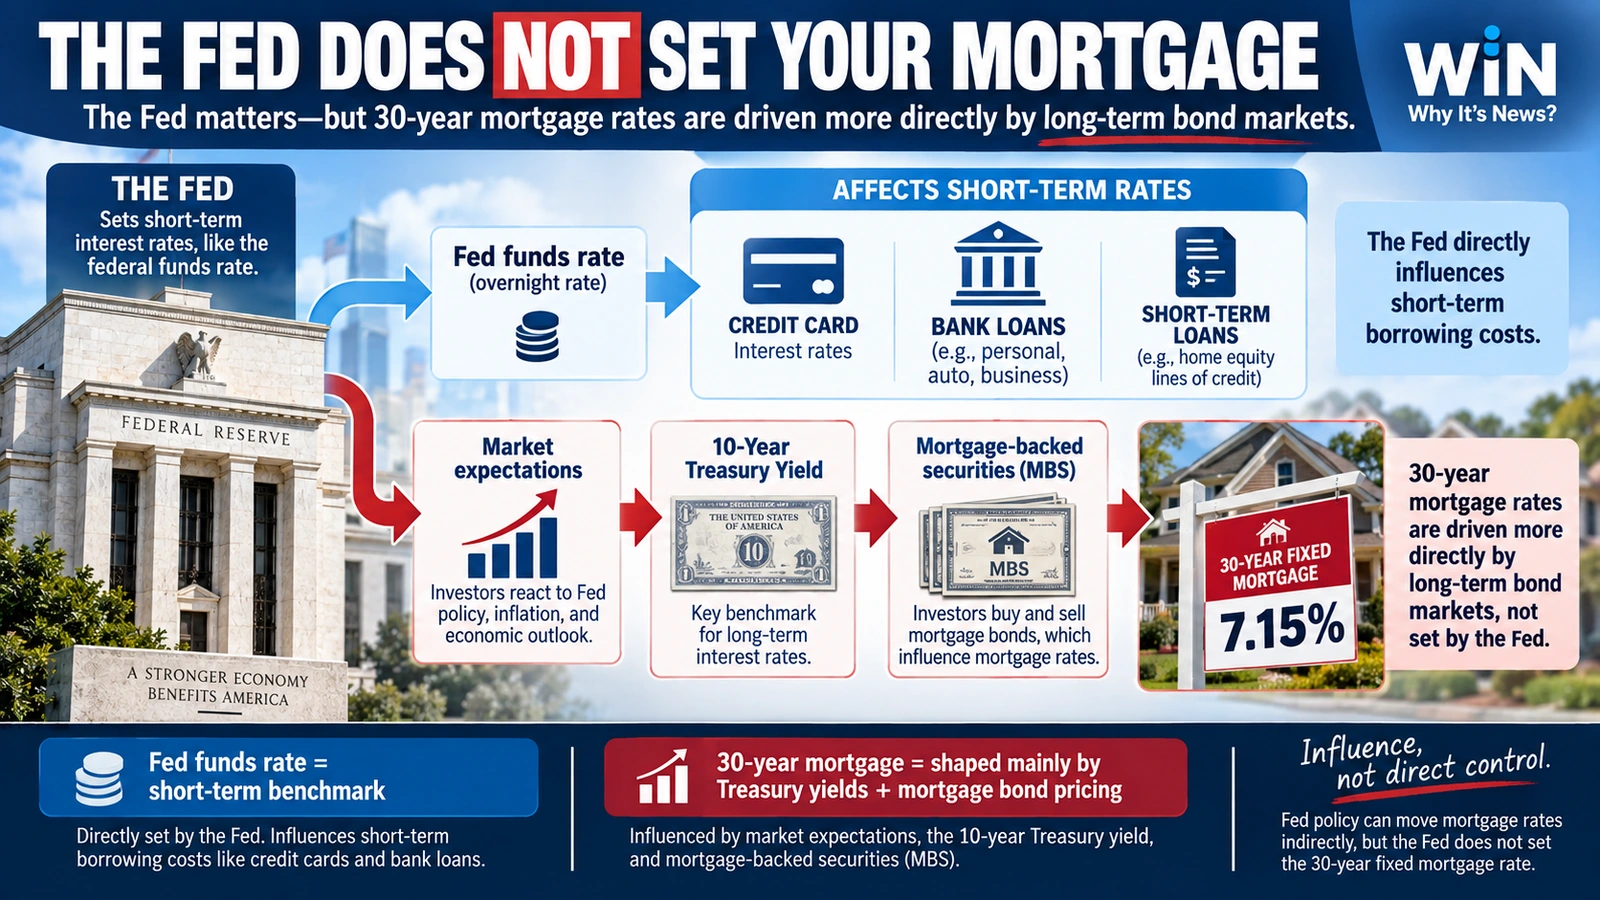
Not directly.
On September 16, the Federal Reserve raised its target range for the federal funds rate by a quarter percentage point to 3.75%–4.00%. That benchmark is an overnight bank-lending rate, not a 30-year mortgage rate. (Federal Reserve)
The Fed matters because its decisions and its inflation outlook change expectations throughout financial markets. But fixed mortgage rates are usually more closely connected to long-term Treasury yields and mortgage-backed-securities pricing than to the overnight federal funds rate itself.
That explains a pattern that often confuses homebuyers: the Fed can raise rates and mortgage rates can fall that day, or the Fed can leave rates unchanged while mortgages rise. Markets may have anticipated the Fed move weeks earlier.
The cleanest distinction is this:
| Rate | Who or what mainly drives it? | Typical effect |
|---|---|---|
| Federal funds target | Federal Reserve | Directly influences overnight and many short-term rates |
| 10-year Treasury yield | Bond market | Reflects inflation, growth, debt supply, and policy expectations |
| 30-year fixed mortgage | Lenders and mortgage bond market | Often moves with long-term Treasury yields, plus mortgage-specific risk and pricing |
The September Fed move still matters. It reinforced the message that inflation remains a concern, and Fed officials continued to signal vigilance afterward. But saying “the Fed set mortgages at 7%” would be wrong. (Federal Reserve · Reuters)
Why Can Your Actual Quote Be Lower—or Higher—Than the Headline?
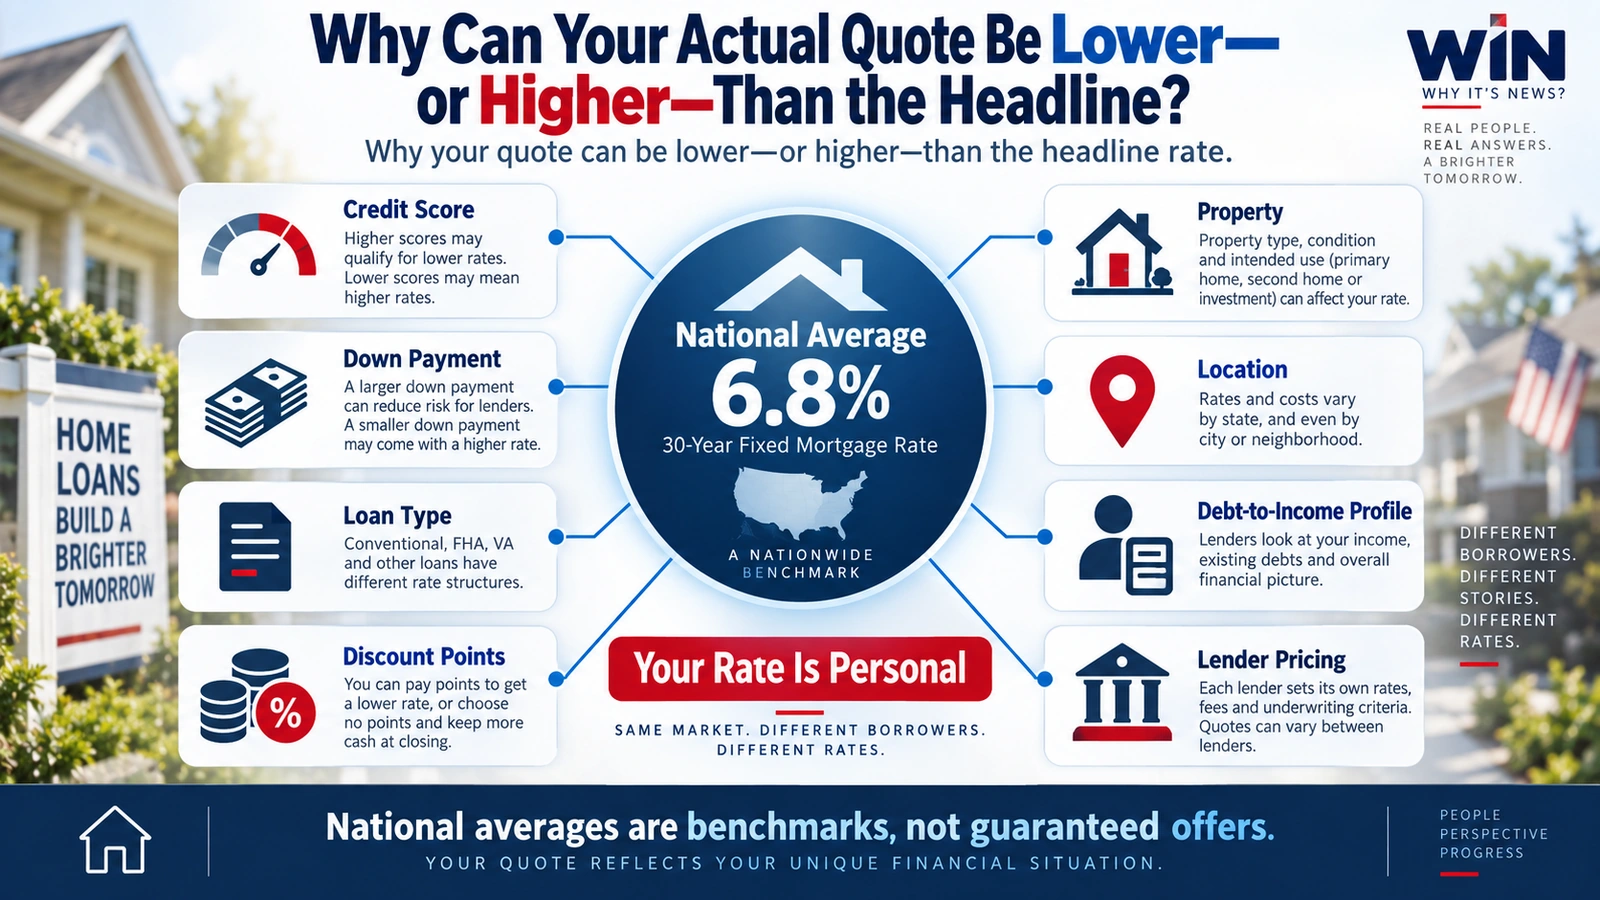
Because a national average is not a personal offer.
A lender is pricing a specific borrower, property, loan amount, loan type, down payment, credit profile, and closing structure. Discount points can also reduce the interest rate in exchange for a higher upfront cost.
Freddie Mac’s benchmark, for example, is intentionally narrow. Its methodology focuses on conventional, conforming purchase loans for owner-occupied homes and a borrower profile designed to reflect strong credit and a 20% down payment. That makes the survey useful for tracking the market over time, but it does not mean every borrower will be offered the Freddie Mac average. (Freddie Mac methodology)
A first-time buyer putting down 5%, a borrower seeking a jumbo loan, a veteran using a VA loan, someone paying discount points, and an owner refinancing an existing loan can all see meaningfully different numbers on the same morning.
That is also why the lowest advertised rate on a comparison site is not necessarily the rate most borrowers will receive. The details behind the number matter.
What Does a Move From 6.76% to 7.15% Mean in Dollars?
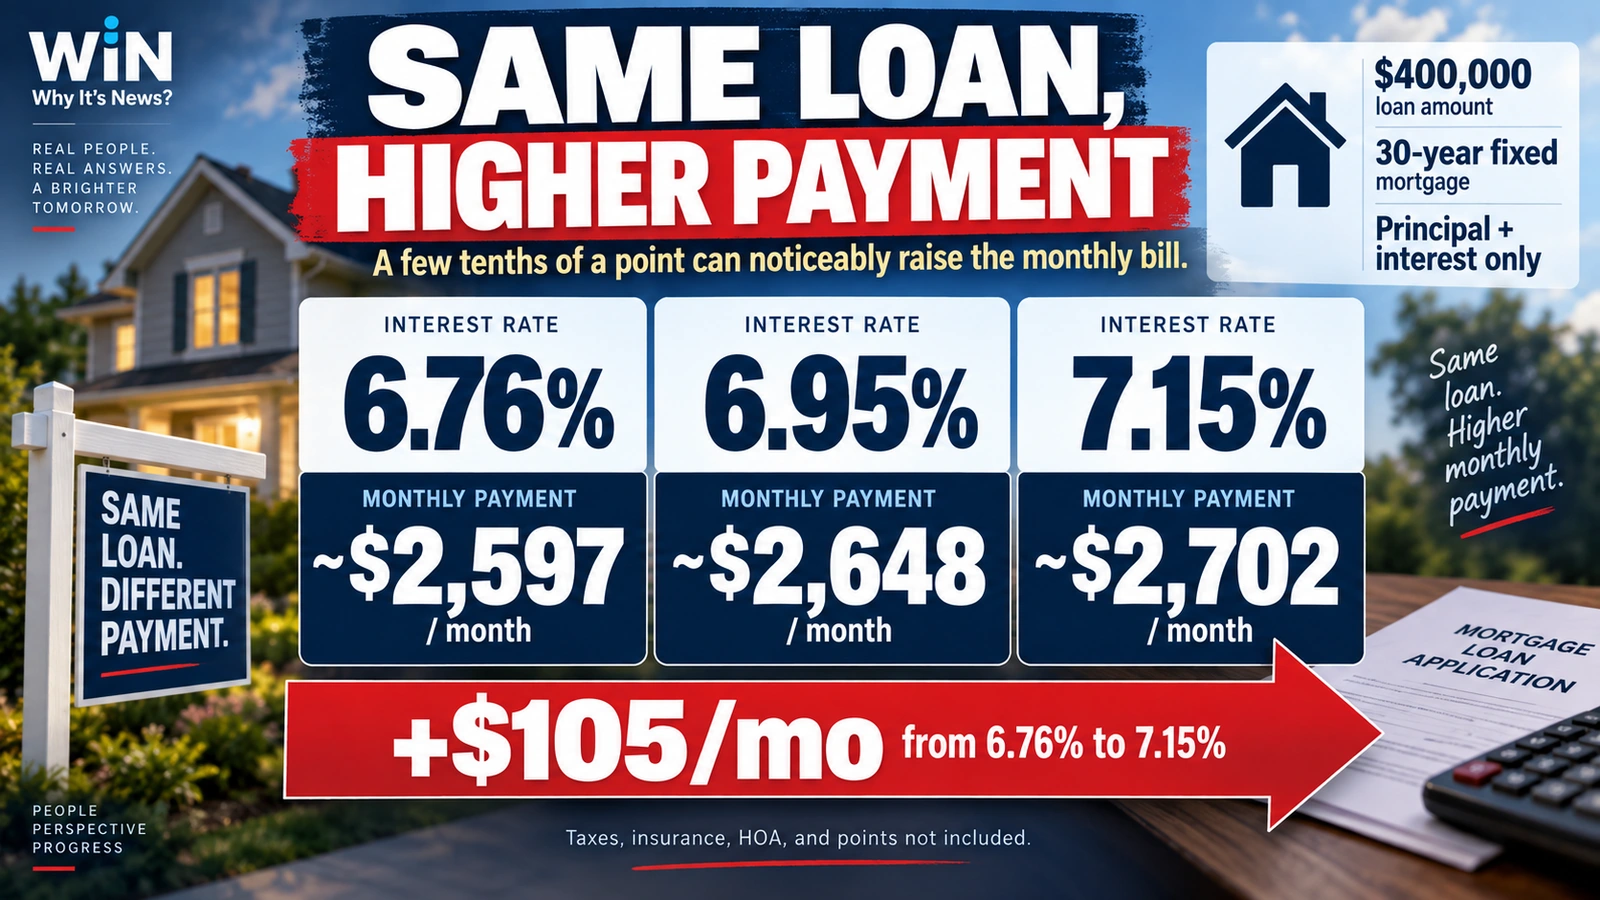
A few tenths of a percentage point can look small on a screen. On a large mortgage, the monthly difference becomes noticeable.
Using a $400,000 30-year fixed mortgage as a simple illustration:
| Interest rate | Approx. monthly principal and interest |
|---|---|
| 6.76% | $2,597 |
| 6.95% | $2,648 |
| 7.15% | $2,702 |
That means moving from 6.76% to 7.15% adds about $105 a month in principal and interest on the same $400,000 balance.
This example is not a lender quote. It excludes property taxes, homeowners insurance, mortgage insurance, HOA dues, closing costs, and any discount points. Its purpose is simply to show why a rate move that looks tiny in percentage terms can change a household budget.
For context, Freddie Mac’s weekly 30-year average rose from 6.76% on September 10 to 6.95% on September 17. (Freddie Mac archive)
Higher financing costs are already showing up in the broader housing market. The National Association of Realtors reported that August existing-home sales fell 2.0% from July, while pending sales were down 4.7% from a year earlier. NAR said higher mortgage rates were restraining demand even as job and income growth supported buyers. (NAR existing-home sales · NAR pending home sales)
What Should Homebuyers Watch Next?
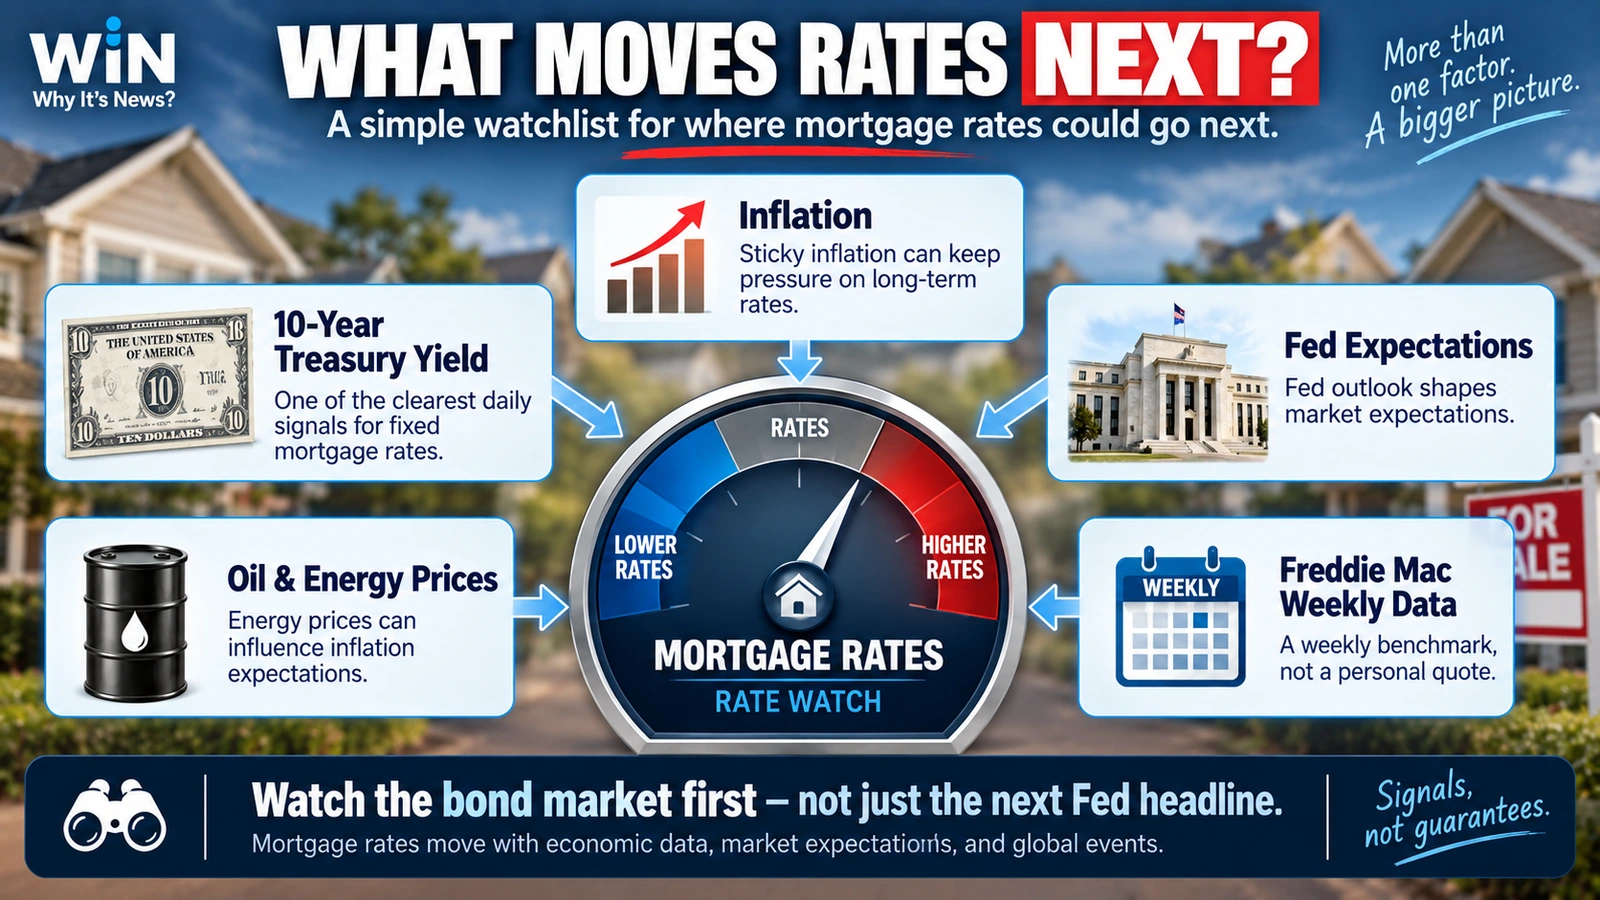
Watch the bond market first, not just the next Fed headline.
The 10-year Treasury yield is one of the clearest daily signals for the direction of fixed mortgage rates. Inflation data, energy prices, government borrowing, economic growth, and expectations for future Fed policy can all move that yield.
The next Freddie Mac release also matters because it will capture a fresh weekly average after the September 16 Fed decision. But even that number will still be a weekly benchmark, not a promise of what a lender will quote a particular borrower on that day.
For someone actually shopping for a mortgage, the practical lesson is simpler than the market mechanics: compare like with like.
If one website is showing a purchase rate and another a refinance rate, they are not comparable. If one number is an interest rate and another is APR, they are not the same measure. If one is a weekly national average and another is a live lender quote, the difference may be entirely normal.
Why It Matters in One Sentence
“Mortgage rates are above 7%” can be true on one daily tracker while Freddie Mac still shows less than 7%, because mortgage-rate headlines come from different borrowers, products, time windows, and cost measures—and the bond market, not the Fed alone, is what keeps pushing the numbers around.
Mortgage Rates Above 7%: Key Questions Explained
Q. Are 30-year mortgage rates above 7% right now?
On some daily national trackers, yes. Bankrate listed a 7.15% average 30-year fixed purchase rate on September 22, while NerdWallet’s Zillow-supplied data showed a 7.15% interest rate and 7.16% APR. Freddie Mac’s latest weekly average was 6.95% as of September 17.
Q. Why does Freddie Mac show 6.95% if other sites show more than 7%?
Freddie Mac publishes a weekly average based on qualifying mortgage applications collected over a Thursday-to-Wednesday period. Daily trackers can move above or below that weekly average before Freddie Mac publishes its next reading.
Q. Is Bankrate’s 7.02% number the same as its 7.15% mortgage rate?
No. On September 22, Bankrate’s 7.02% figure referred to a 30-year fixed refinance average, while 7.15% was the 30-year fixed purchase average.
Q. Why does NerdWallet show 7.16% when the interest rate is 7.15%?
The 7.16% figure is APR. APR can include certain loan costs in addition to the interest rate, so it can be slightly higher than the stated interest rate.
Q. Did the Federal Reserve set mortgage rates above 7%?
No. The Fed sets a target range for the overnight federal funds rate. Fixed mortgage rates are more closely linked to long-term bond yields and mortgage-backed-securities pricing, although Fed policy can strongly influence those markets.
Q. Why does the 10-year Treasury matter for a 30-year mortgage?
Both are long-term fixed-income investments competing for investor capital. Mortgage-backed securities generally must offer investors enough return relative to safer Treasury securities, so mortgage rates often move in the same direction as long-term Treasury yields.
Q. Why can my mortgage quote differ from the national average?
Your quote reflects your credit profile, down payment, loan amount, loan type, property, location, lender pricing, and whether you pay discount points. National averages are benchmarks, not guaranteed offers.
Q. How much can a few tenths of a percentage point change the payment?
On a $400,000 30-year mortgage, principal and interest are about $2,597 a month at 6.76% and about $2,702 at 7.15%—roughly a $105 monthly difference before taxes, insurance, and other housing costs.
Did this help make the story clearer? 🙂
WIN keeps unpacking the “why” behind the news—clearly and simply!
Sources
Daily Mortgage Rate Benchmarks
Bankrate — Current Mortgage Rates
Bankrate — 30-Year Refinance Rates
NerdWallet — Mortgage Rates for September 22, 2026
Freddie Mac — Primary Mortgage Market Survey
How Mortgage Rates Are Measured and Priced
Freddie Mac — Enhanced Mortgage Rate Survey Explained
Freddie Mac — Mortgage Rates and Treasury Yields
Reuters — 10-Year Treasury Yield Hit 5.041% on September 15
Charles Schwab — September 22 Market Update Showing 10-Year Treasury at 4.93%
Federal Reserve and Housing-Market Context
Federal Reserve — September 16, 2026 FOMC Statement
Reuters — Fed’s Collins Says She Supported Rate Hike, Warns of Elevated Inflation Risks
National Association of Realtors — August Existing-Home Sales
National Association of Realtors — August Pending Home Sales