Why Did U.S. Wholesale Prices Jump 1.3%—and Could Your Bills Rise Next?

Gasoline is already expensive. Now there’s another worrying inflation headline: U.S. wholesale prices jumped 1.3% in a single month.
Does that mean everything in your shopping cart is about to cost 1.3% more?
No. The number measures prices received by producers, not a guaranteed increase at the checkout counter. But it does reveal pressure building in parts of the economy that households depend on—especially fuel and shipping.
The important question is what happens between a business facing higher costs and a customer seeing a higher price tag.
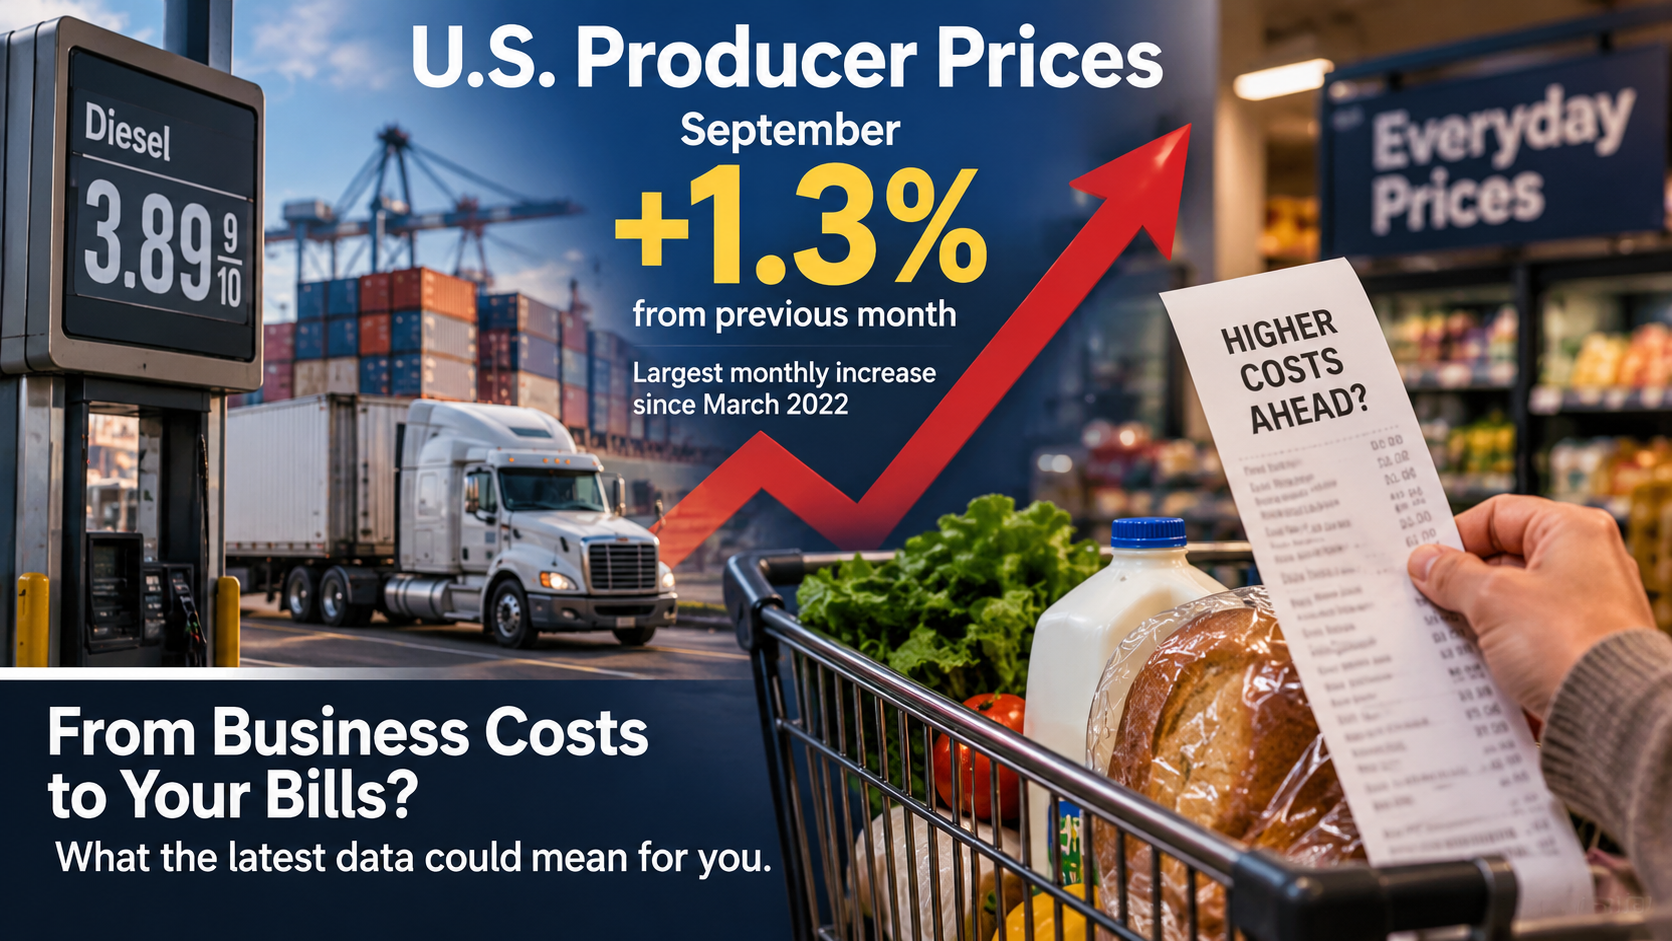
※ Images in this article are AI-generated illustrations created to help explain the story. They are not actual photographs, and depictions of people, places, or events may differ slightly from reality.
What Does a 1.3% Wholesale Price Increase Actually Mean?
The 1.3% figure is the month-over-month increase in the Producer Price Index (PPI) for final demand in September 2026. The Bureau of Labor Statistics released the report on October 15. It was the biggest monthly increase since March 2022, and the index was 6.3% higher than a year earlier. (Bureau of Labor Statistics)
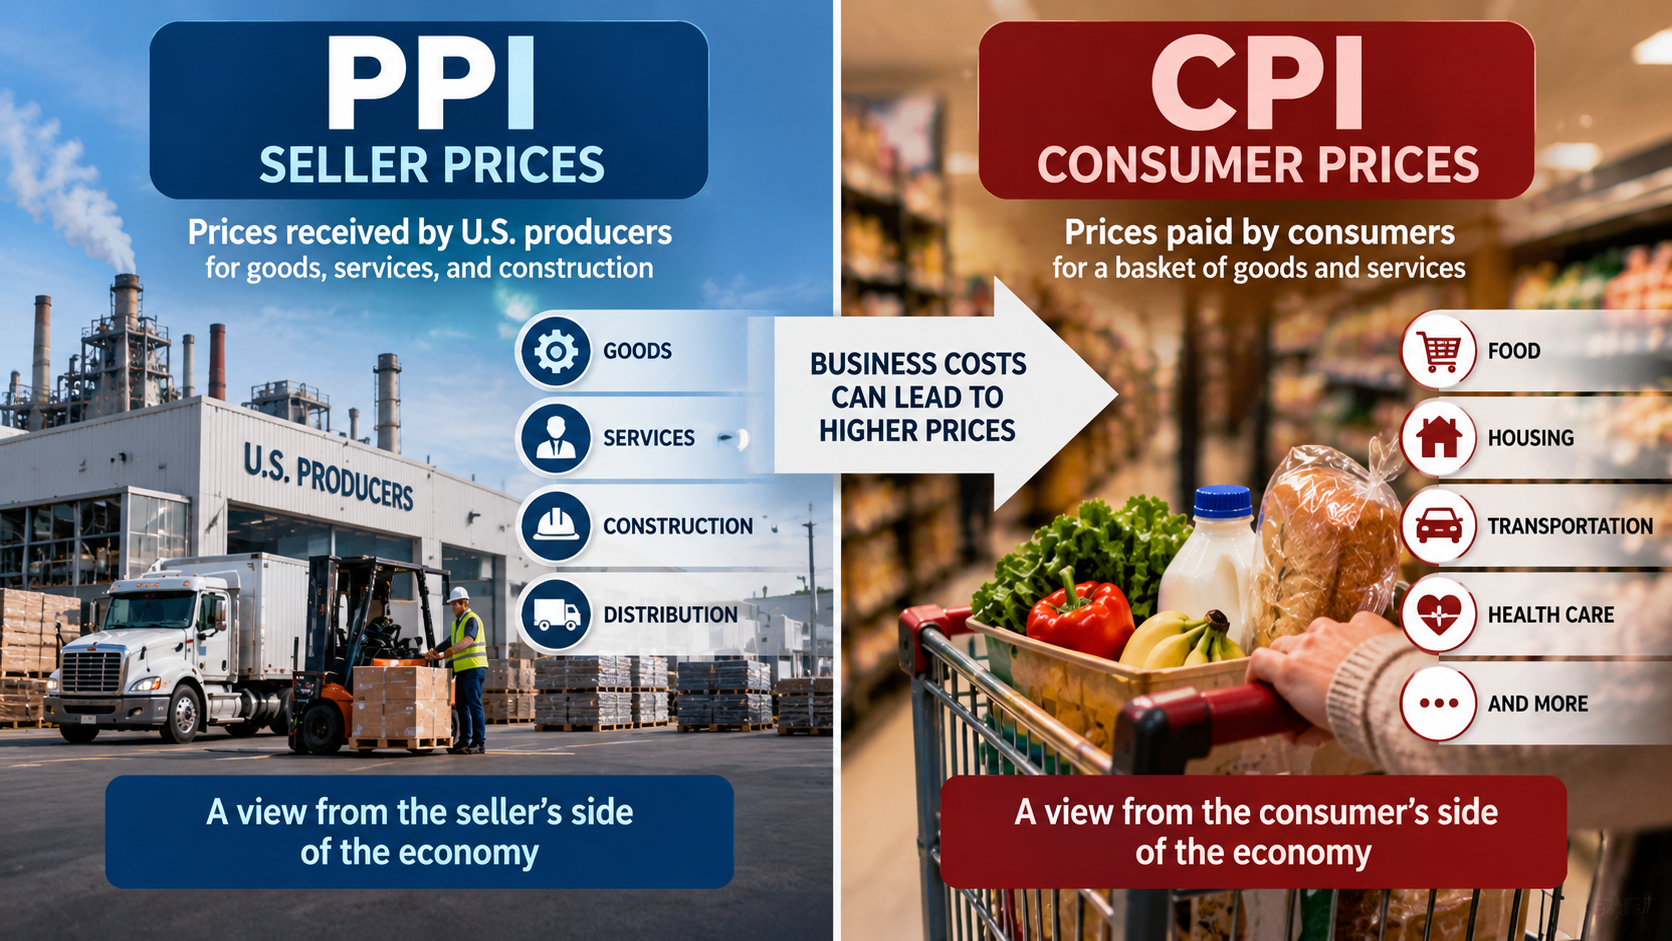
Despite the nickname wholesale inflation, the PPI measures more than goods sitting in warehouses. It tracks prices received by U.S. producers for a broad mix of goods, services, and construction. That includes business services and distribution costs, not just factory products.
Think of it as a view from the seller’s side of a transaction. The Consumer Price Index (CPI), by contrast, is designed to track prices paid by consumers for a basket of goods and services. The two indexes cover different transactions and can move at different speeds. (Bureau of Labor Statistics)
There’s another distinction worth keeping straight: 1.3% is one month’s change; 6.3% is the change over 12 months. Neither means that every company raised its prices by exactly that amount.
Why Did Energy Send Producer Prices So Much Higher?
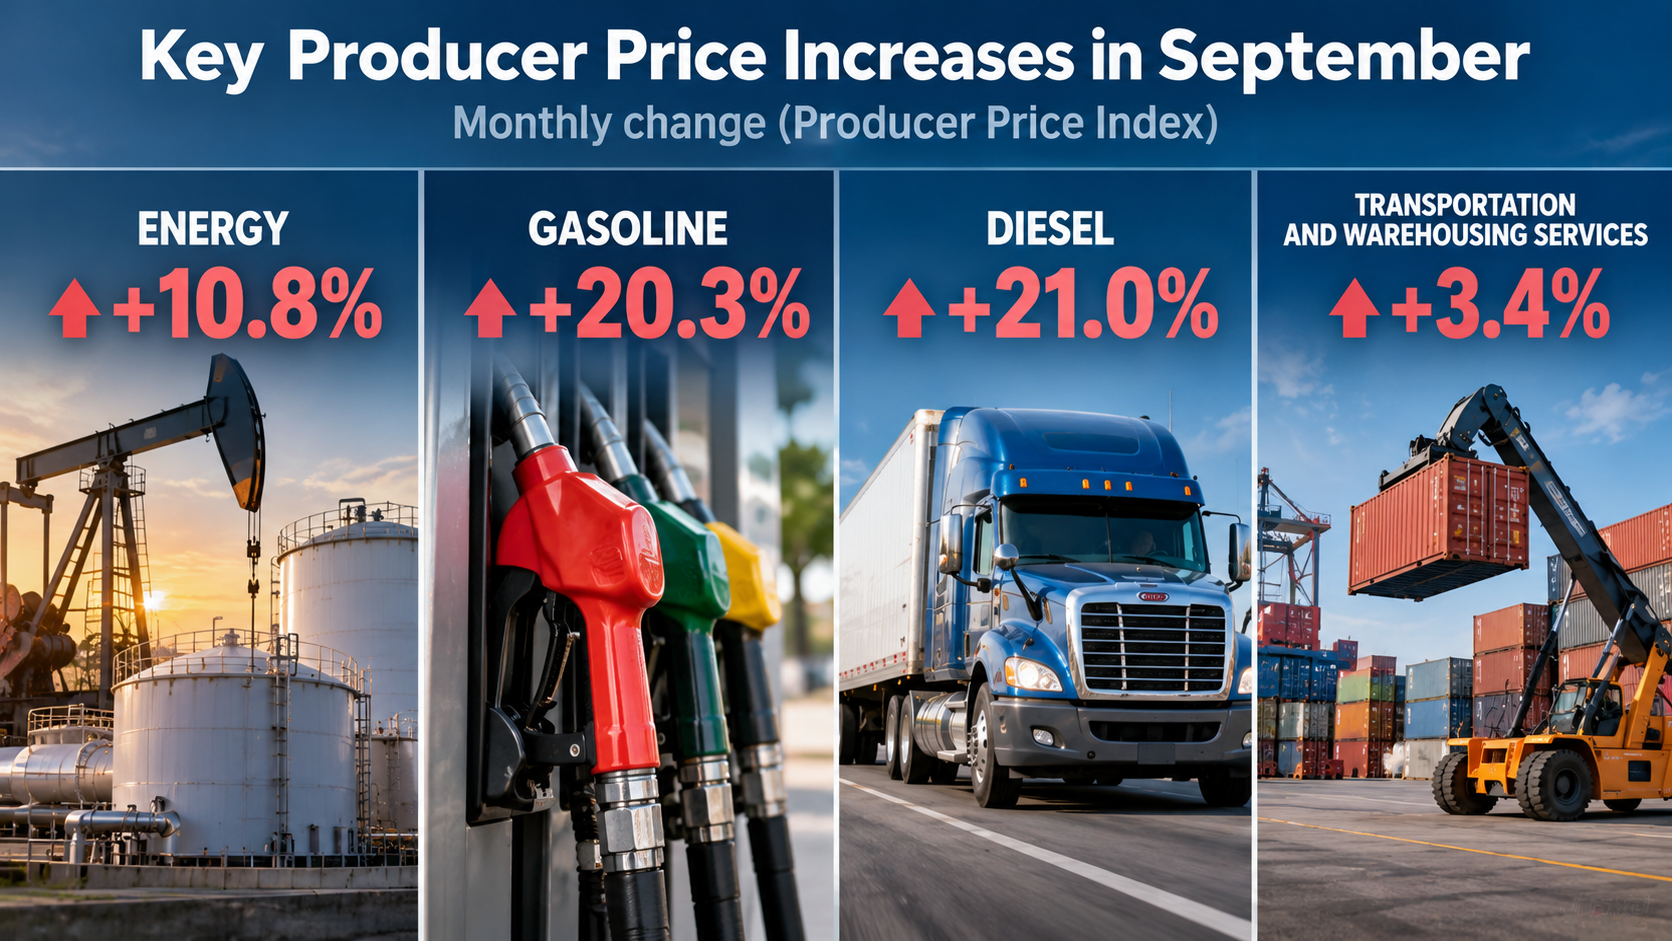
Energy was the biggest driver. In September, prices for final-demand goods rose 2.6%, while prices for final-demand services rose 0.8%. Within goods, energy prices surged 10.8%. The BLS says energy accounted for more than 80% of the increase in goods prices, with gasoline alone responsible for roughly half of that increase. (Bureau of Labor Statistics)
The fuel figures are striking, but they describe producer-price categories, not a one-month increase on every driver’s receipt:
| September 2026 PPI component | Monthly change |
|---|---|
| Final-demand goods | +2.6% |
| Final-demand services | +0.8% |
| Final-demand energy | +10.8% |
| Gasoline | +20.3% |
| No. 2 diesel fuel | +21.0% |
| Transportation and warehousing services | +3.4% |
These are overlapping categories within the PPI system, so their percentages should not be added together. (Bureau of Labor Statistics)
Why does diesel deserve special attention? Millions of Americans never put diesel in their cars, but trucks and equipment move food, packages, building supplies, and other goods. Higher fuel costs can make those operations more expensive before a product reaches a store. Reuters reported that the September diesel surge was already putting pressure on freight and other sectors. (Reuters)
Higher oil costs tied to Middle East conflict were part of the broader backdrop. But the PPI report itself establishes what prices changed; it does not prove that one geopolitical event caused every increase. (Reuters)
Was Inflation Spreading Beyond Gasoline and Diesel?
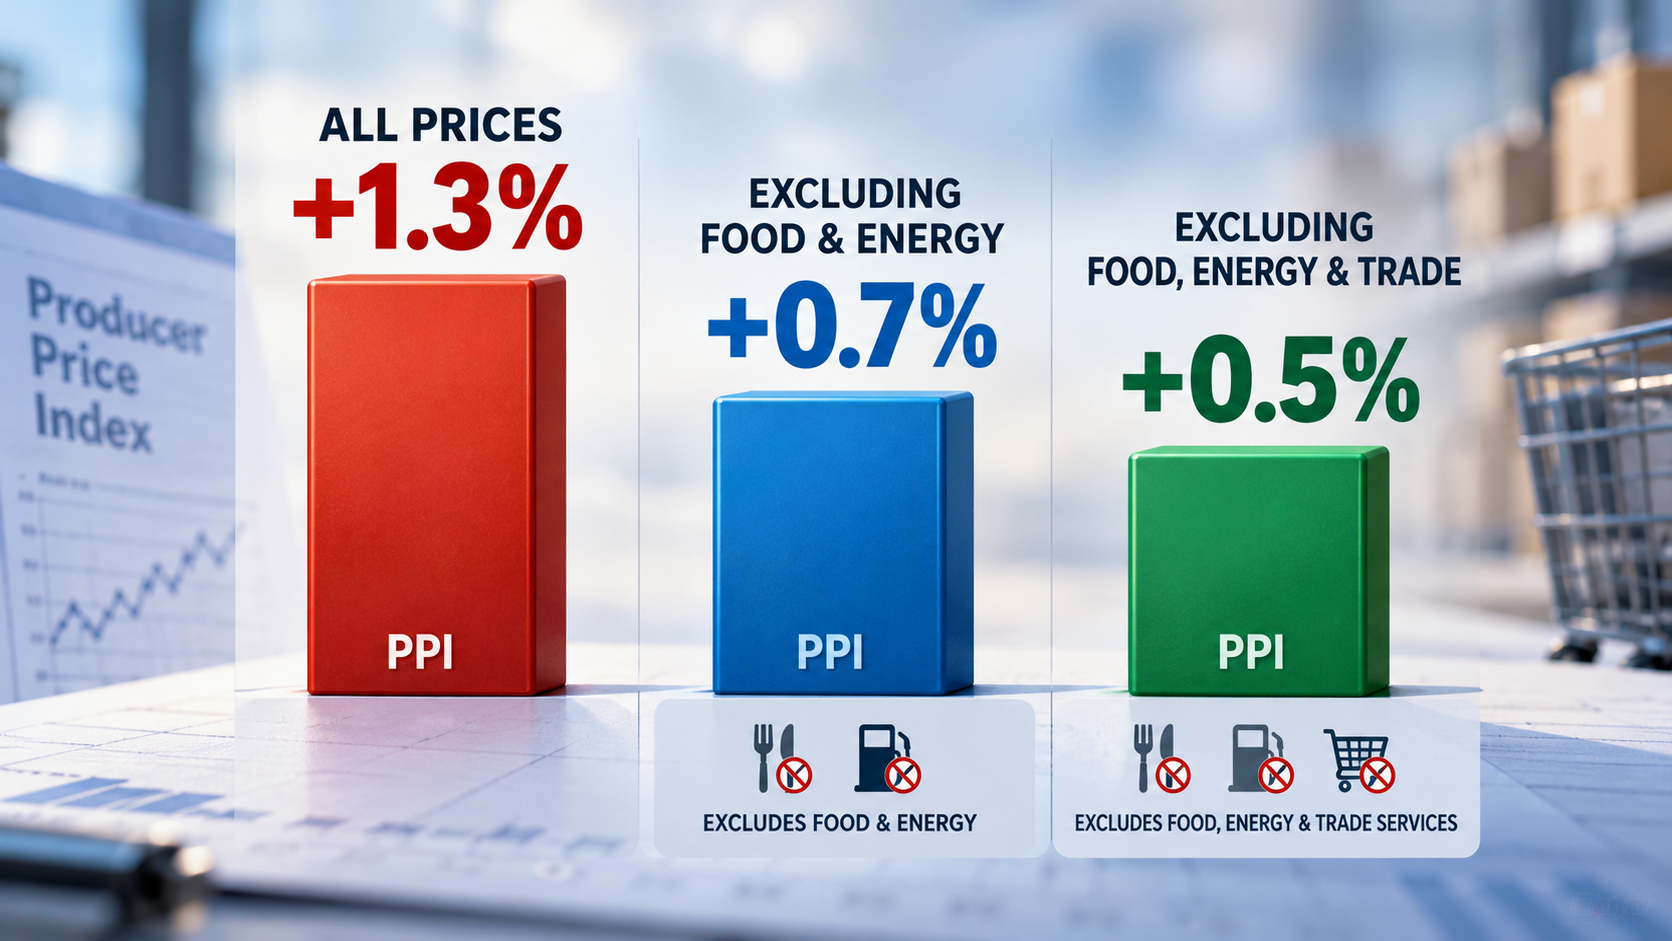
Yes. Energy explains much of the jump, but it doesn’t explain everything.
The overall PPI climbed 1.3%. Excluding food and energy, it rose 0.7%. A narrower measure that also excludes trade services increased 0.5%, up from 0.3% in August. These are different definitions, not competing reports of the same number. (Bureau of Labor Statistics)
Trade services also need an explanation: that category measures changes in the margins wholesalers and retailers receive, rather than simply the sticker prices of products they sell. The BLS reported a 1.4% increase in final-demand trade-service margins during September. (Bureau of Labor Statistics)
So the headline was largely an energy story, but underlying price pressure was not confined to gasoline pumps. That makes the report harder to dismiss as a single volatile number.
When Do Higher Business Costs Show Up in Household Bills?
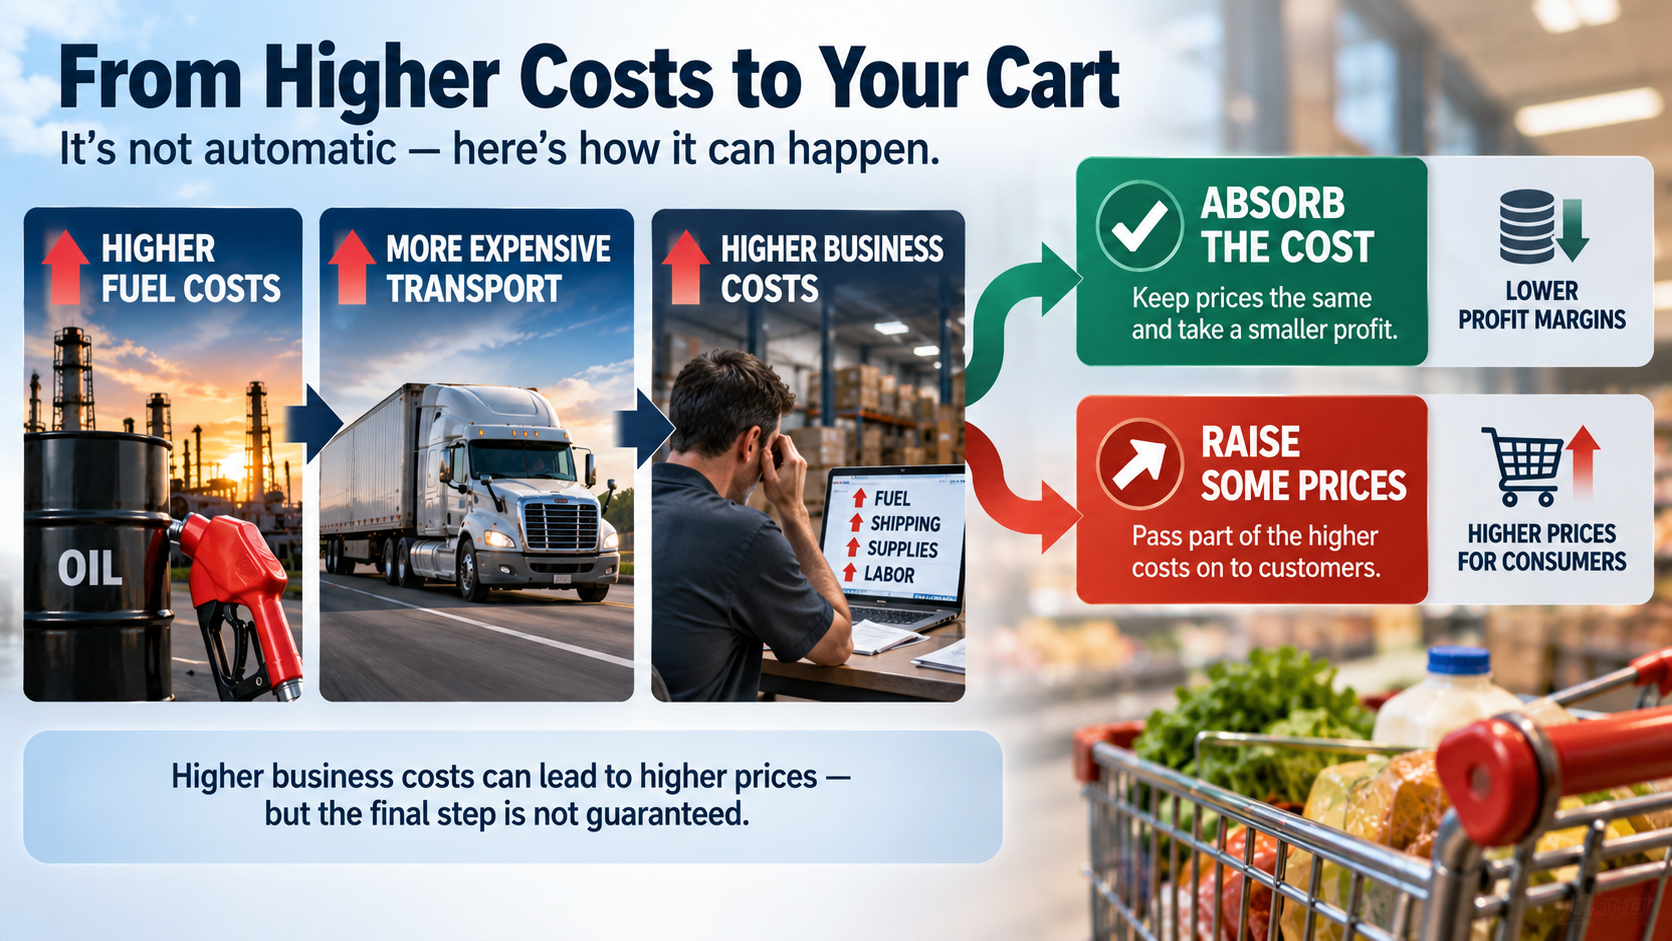
There is no automatic schedule. Some higher costs reach consumers quickly; others arrive months later, partly—or not at all.
Imagine a delivery business facing higher diesel expenses. It might raise shipping fees, trim its profit margin, renegotiate contracts, or offset part of the expense somewhere else. If a retailer then faces a larger delivery bill, it has its own choices to make.
That creates a useful way to understand the possible chain:
Higher fuel costs → more expensive transport → pressure on business margins → possible retail-price increases.
The final arrow is not guaranteed. Competition, contracts, existing inventory, consumer demand, and the amount of cost a company can absorb all matter. Even when prices rise, the change need not match the original fuel increase.
For households, the most direct pressure from an energy shock can appear at the gas pump or in certain travel costs. Food, online deliveries, and other purchases may be affected later through shipping or production expenses. The report signals risk; it does not announce a 1.3% surcharge on everyone’s bills.
How Does the PPI Compare With Inflation Shoppers Already See?
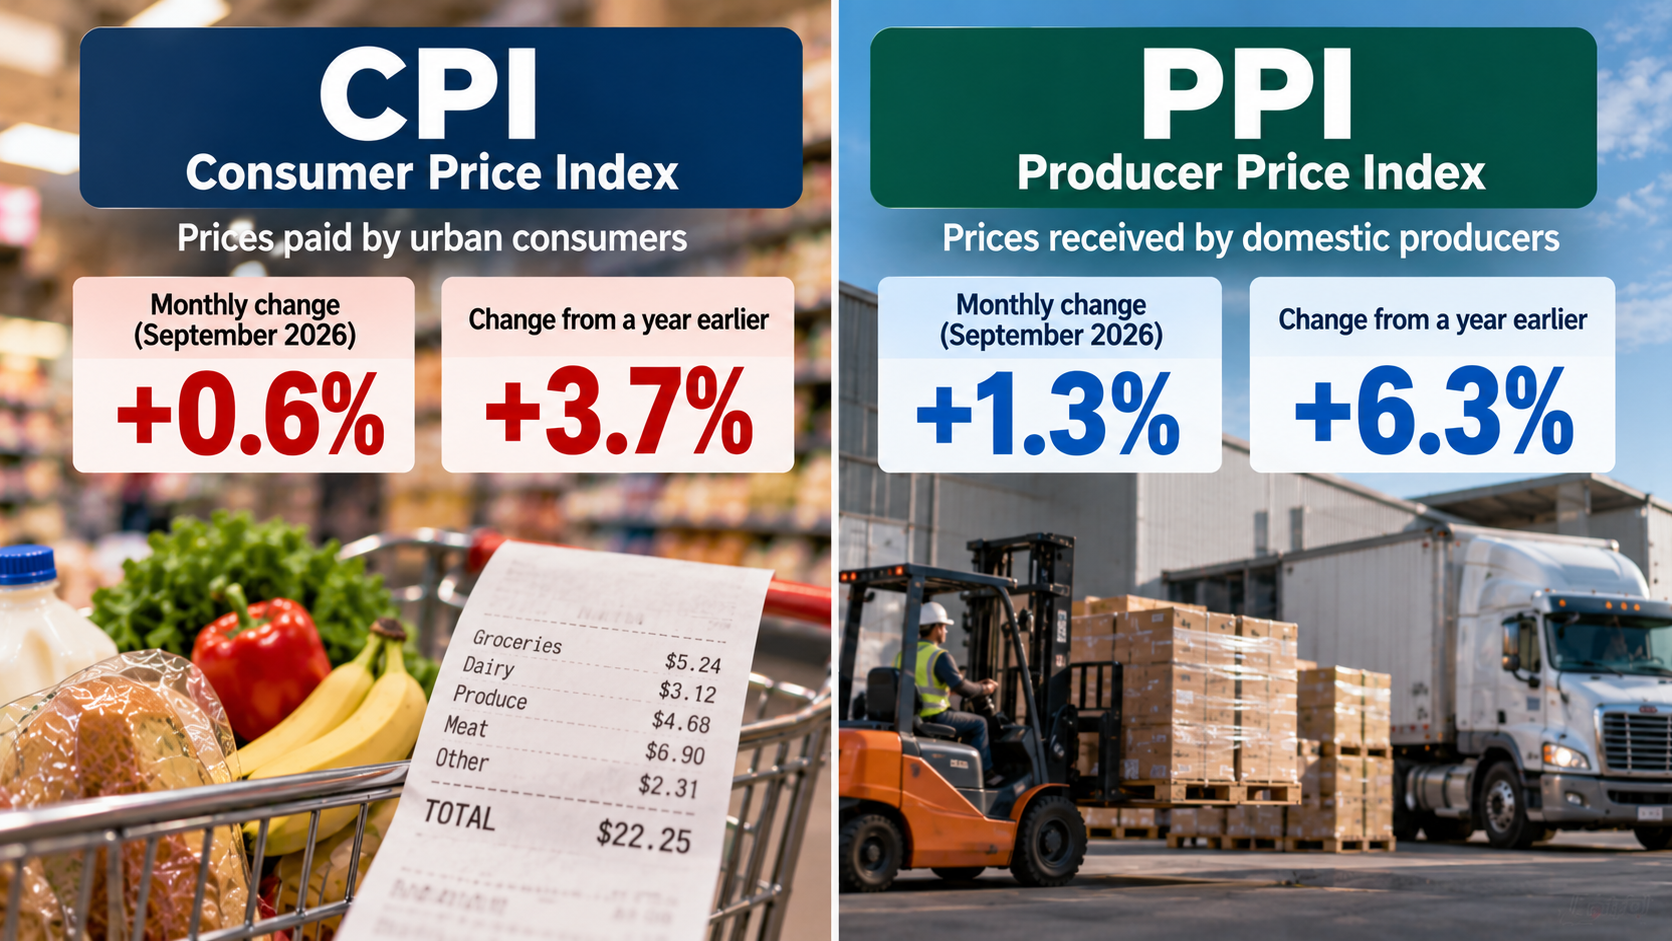
Consumers had already received an uncomfortable inflation report the day before the PPI numbers came out.
On October 14, the BLS reported that the September CPI rose 0.6% from August and 3.7% from a year earlier. Consumer gasoline prices rose 9.1% during the month, accounting for more than half of the overall monthly CPI increase. Meanwhile, the food-at-home index edged down 0.1%. (Bureau of Labor Statistics)
Here are the two reports side by side:
| What is being measured? | September monthly change | Change from a year earlier |
|---|---|---|
| PPI: prices received by domestic producers | +1.3% | +6.3% |
| CPI: prices paid by urban consumers | +0.6% | +3.7% |
The monthly figures are seasonally adjusted; the annual figures are unadjusted. The indexes have different coverage and weights, so the fact that PPI is higher than CPI doesn’t tell us that the missing difference will eventually be added to consumer prices. (Bureau of Labor Statistics · Bureau of Labor Statistics: CPI)
The more revealing connection is that both reports pointed to significant September energy inflation. Producer prices offer one angle on business costs; consumer prices show what households were already paying. Neither can tell us by itself exactly what a grocery or utility bill will be next month.
Does This Make Another Fed Rate Hike More Likely?
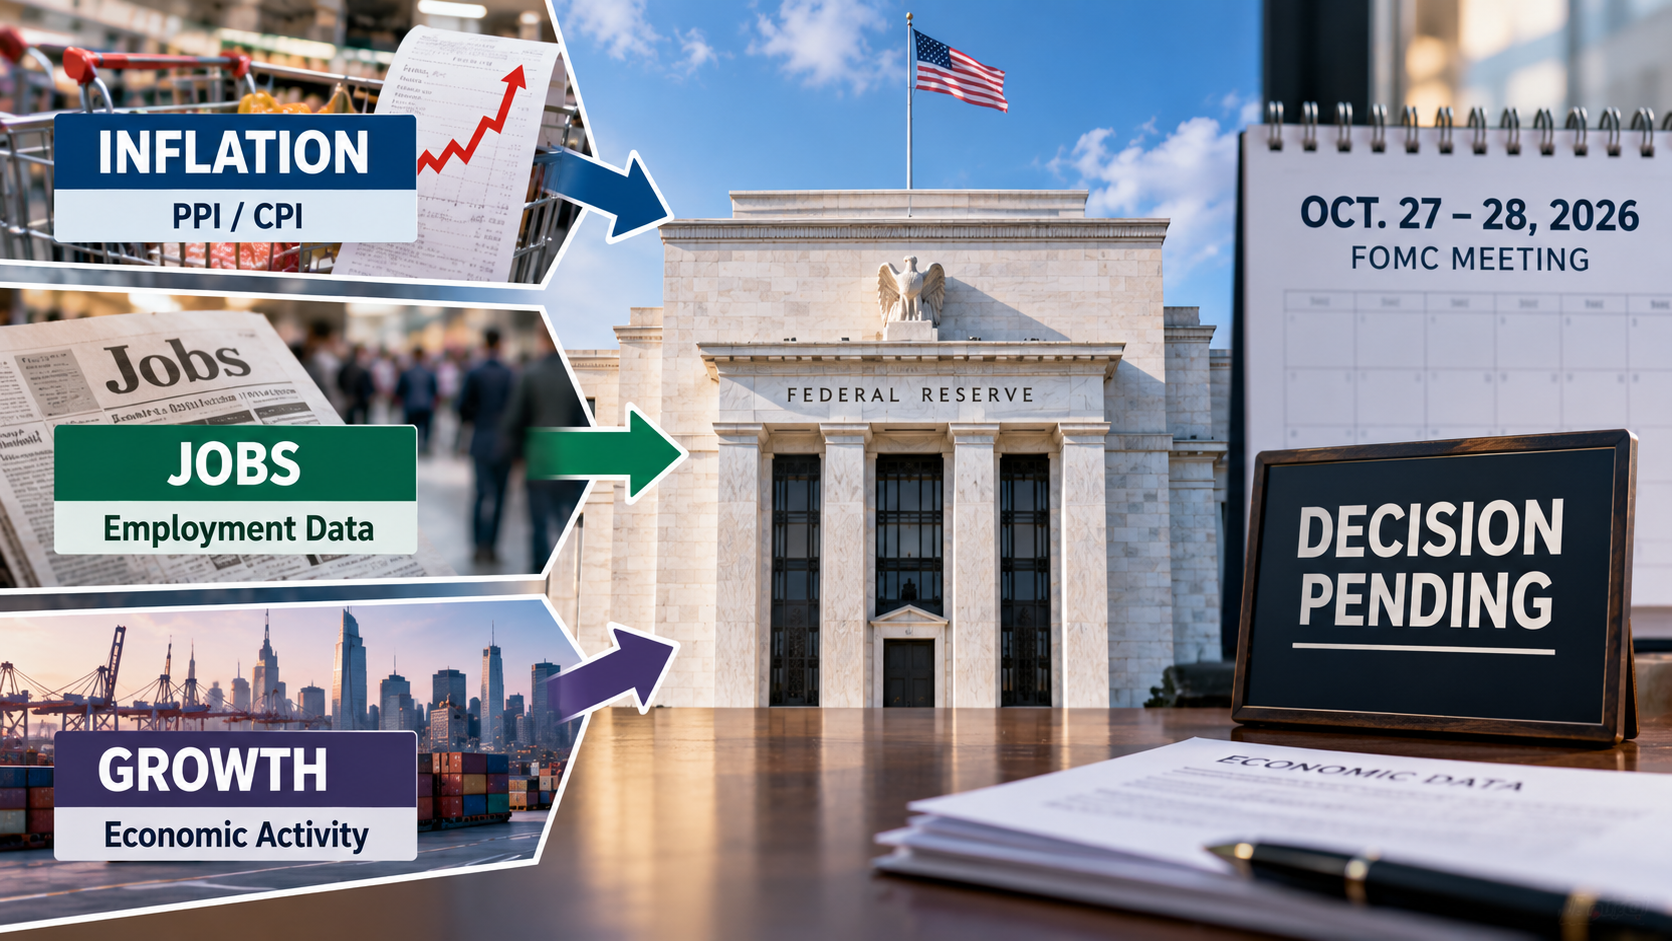
The hot PPI report adds to the case for keeping monetary policy restrictive, but it does not guarantee another interest-rate increase.
The Federal Reserve raised its benchmark target range to 3.75%–4.00% on September 16, citing inflation that remained above its 2% goal. The next Federal Open Market Committee meeting is scheduled for October 27–28. (Federal Reserve · Federal Reserve meeting calendar)
Why does the PPI matter to the Fed if it isn’t a consumer inflation report? Some producer-price data are used in compiling the Personal Consumption Expenditures (PCE) price index, a key inflation measure for Fed policymakers. A hot PPI reading can therefore influence expectations about broader inflation—but it is just one piece of the evidence. (Reuters)
Officials also have to weigh employment, economic growth, and whether price pressures appear temporary or persistent. Higher fuel costs caused by supply disruptions present a different challenge from broad inflation driven by exceptionally strong demand.
And a Fed decision would not move every household rate equally. Many variable-rate credit products react more directly to short-term interest rates. Fixed mortgage rates are influenced heavily by longer-term Treasury yields and financial-market expectations; a Fed hike would not mechanically raise every existing mortgage payment.
What Should Americans Watch Next?
Three developments will help distinguish a brief energy shock from a more persistent rise in living costs.
First, fuel and freight prices. If diesel and shipping costs remain elevated, more companies may face decisions about whether to absorb costs or change what they charge. If those costs ease, some pressure could fade before reaching store shelves.
Second, consumer inflation and underlying price measures. September’s CPI already reflected higher gasoline prices, but it did not show every consumer category rising at the same pace. The next reports will help show whether price increases are spreading more broadly.
Third, the Fed’s October 27–28 meeting. Policymakers must balance inflation with employment and economic activity. The September producer-price report is important evidence, not a predetermined interest-rate decision. (Federal Reserve)
For the average household, the immediate takeaway is practical rather than predictive: one headline number cannot tell you what your next grocery receipt, rent payment, or mortgage quote will be.
Bottom Line: What This Story Really Means
U.S. wholesale inflation jumped 1.3% in September 2026 because energy costs surged, with gasoline and diesel standing out. Prices for transportation services and several other categories also increased. The annual PPI inflation rate reached 6.3%.
That is a warning about costs moving through the economy—not proof that consumers will face a matching 1.3% price increase.
Businesses may absorb some expenses, pass others through, or adjust prices after a delay. Consumers are already feeling higher gasoline prices, while the longer-term impact on groceries, delivery charges, and other bills remains uncertain.
The report also gives the Federal Reserve another reason to examine inflation carefully before its next meeting. What matters now is whether September’s cost shock fades—or keeps spreading.
Producer Price Index: Key Questions Explained
Q. How much did U.S. producer prices rise in September 2026?
The Producer Price Index for final demand rose 1.3% from August, the largest monthly gain since March 2022. It increased 6.3% over the previous 12 months.
Q. When was the September 2026 PPI report released?
The Bureau of Labor Statistics released it on October 15, 2026, at 8:30 a.m. Eastern Time.
Q. Did consumers’ bills jump by 1.3% in September?
Not according to that statistic. The 1.3% figure measures producer prices, not an across-the-board increase in household bills. September’s separate CPI report showed a 0.6% monthly increase.
Q. Which prices drove the PPI increase?
Energy was the dominant factor. Producer-price measures for gasoline rose 20.3%, diesel fuel 21.0%, and final-demand energy overall 10.8% during September.
Q. What does PPI stand for?
PPI stands for Producer Price Index. It tracks changes in prices received by domestic producers for goods, services, and construction.
Q. What was core PPI in September 2026?
The PPI excluding food, energy, and trade services rose 0.5%. A different measure that excludes food and energy but includes trade services rose 0.7%. Both figures are valid because the exclusions differ.
Q. Will expensive diesel make groceries cost more?
It could put upward pressure on groceries through farming, freight, and distribution costs. But timing and size depend on companies’ contracts, margins, competition, and pricing decisions; an increase is not automatic.
Q. Does the report mean the Fed will raise interest rates in October?
No. The Fed’s next policy meeting is October 27–28, but the September PPI does not decide the outcome. Policymakers also assess consumer inflation, employment, and growth.
Q. Is PPI the same as the Consumer Price Index?
No. PPI measures prices received by producers, while CPI measures prices paid by consumers. They cover different sets of transactions, so their inflation rates are not directly interchangeable.
Did this help make the story clearer? 🙂 WIN keeps unpacking the “why” behind the news—clearly and simply!
Sources
September Producer Prices and the Energy Shock
Bureau of Labor Statistics — Producer Price Index, September 2026
Reuters — U.S. Producer Prices Post Largest Gain in 4½ Years
Reuters — How Diesel’s Surge Is Pressuring Other Prices
Consumer Prices and What the Indexes Measure
Bureau of Labor Statistics — Consumer Price Index, September 2026
Bureau of Labor Statistics — How the PPI Differs From the CPI
Federal Reserve Policy and Upcoming Decisions
Federal Reserve — September 16, 2026 FOMC Statement
Federal Reserve — 2026 FOMC Meeting Calendar
Keep Reading
Why Did Weak Hiring Make Another Rate Hike Look Less Likely?
Earlier in October, a weak jobs report lowered market expectations for another near-term Fed rate increase. The PPI surge highlights the inflation risk policymakers must weigh against slower hiring.
Why Did Stocks Rise After a Weak Jobs Report—and What Does 29,000 New Jobs Really Mean?
Why Didn’t the Fed’s September Rate Hike Raise Every Borrowing Rate Equally?
The Fed’s last decision provides the background: variable-rate credit cards can respond quickly, while fixed mortgages and savings rates follow different pricing mechanisms.
Why Did the Fed Raise Rates Again—and What Does It Mean for Mortgages, Credit Cards, and Savings?
Why Can Mortgage Rates Rise Before the Fed Makes a Move?
Mortgage rates can move before the Fed acts, and two rate trackers may show different readings for valid reasons. This earlier explainer walks through the bond-market connection and the differences among published mortgage rates.
Why Are Mortgage Rates Back Above 7%—and Why Does Every Website Show a Different Number?