Did Half of Europe Really Feel Like 100°F? What the 52% Heat-Stress Number Actually Means

“Did more than half of Europe really feel hotter than 100°F this summer?”
At first glance, that sounds like a single day when half the continent was trapped under triple-digit heat.
That is not what the new number means.
The European Union’s Copernicus Climate Change Service reported on October 2 that 52% of European land experienced a Universal Thermal Climate Index, or UTCI, of at least 38°C—about 100°F—at least once during the summer of 2026. The figure is cumulative across June, July, and August. It does not mean 52% of Europe crossed that threshold at the same time. (Copernicus · Reuters)
That distinction matters.
But it does not make the summer ordinary.
Western Europe recorded its warmest summer on record. Major rivers experienced extraordinarily low flows. Wildfire activity surged. Seas surrounding Europe were unusually warm. And the effects reached beyond weather into freight transportation, agriculture, water supplies, hydropower, and the cooling systems used by some nuclear plants. (Copernicus)
※ Images in this article are AI-generated illustrations created to help explain the story. They are not actual photographs, and depictions of people, places, or events may differ slightly from reality.
The easiest way to understand the story is to start with that 52% figure—and what it does, and does not, tell us.
What Does “52% of Europe” Actually Mean?
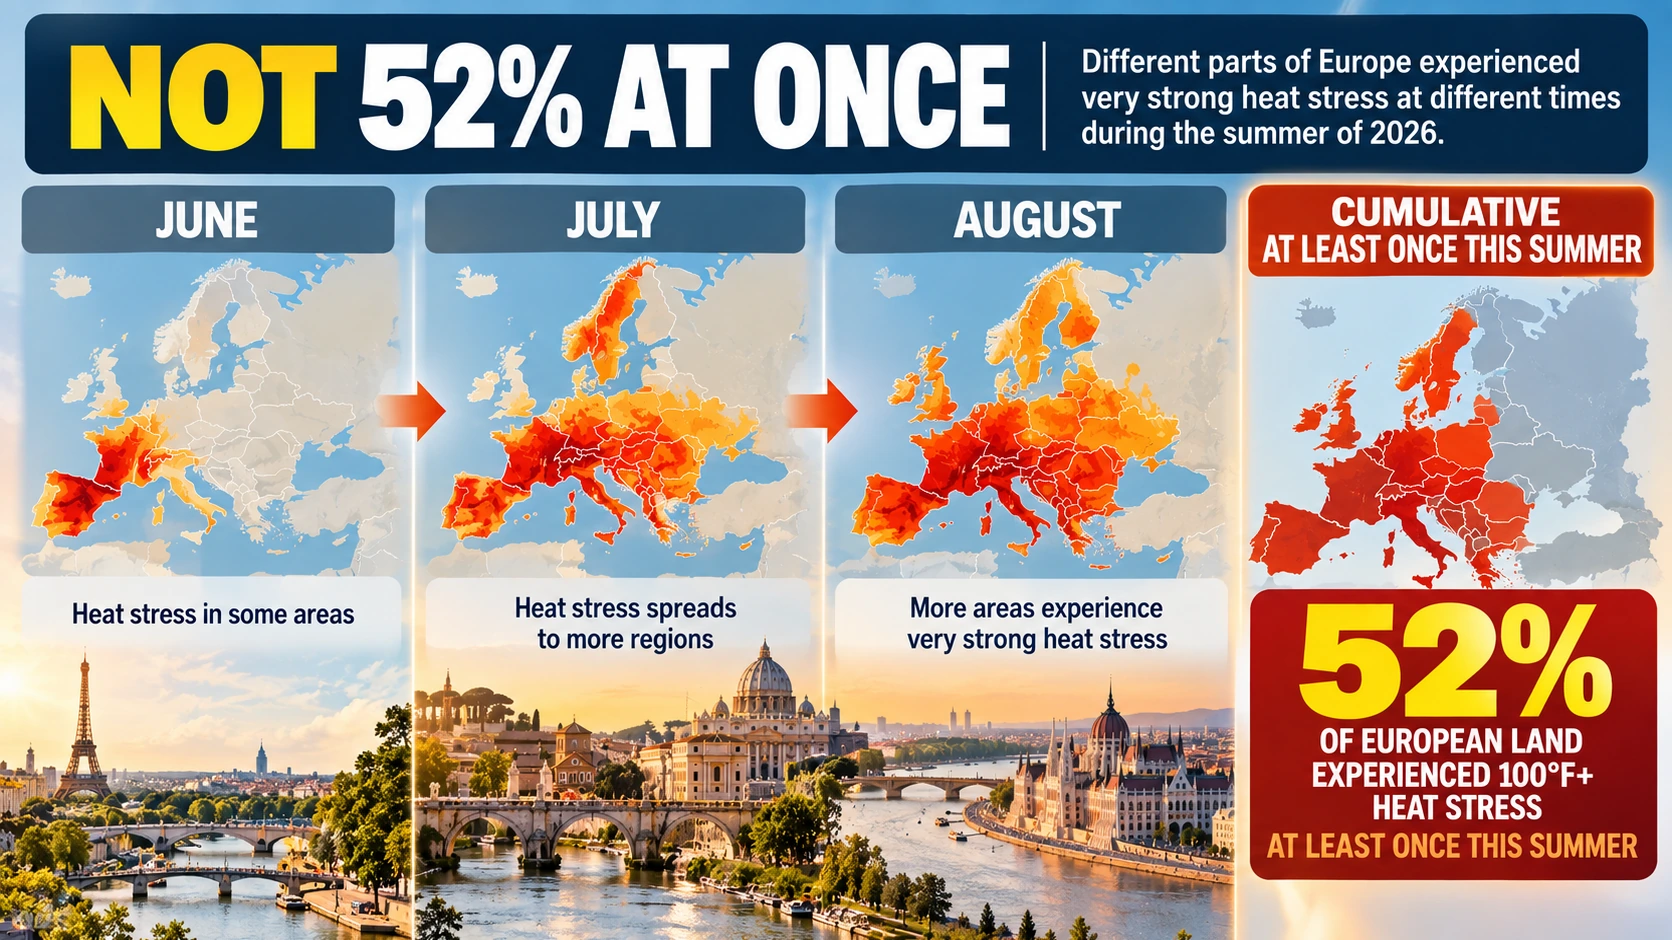
The 52% figure measures how much European land crossed the “very strong heat stress” threshold at least once over the course of the summer.
Imagine one part of France crosses the threshold in June, part of Italy does so in July, and another area in the Balkans does so in August. All of those places count toward the season’s cumulative total.
Copernicus makes this explicit in its 2026 summer review. The 52% chart shows an increasing total through the season, not the land area simultaneously experiencing that level of heat on a particular day. (Copernicus European Summer Review)
So the most accurate way to say it is:
During summer 2026, 52% of European land experienced a UTCI “feels-like” temperature of at least 38°C, or about 100°F, on at least one occasion.
That is a very different statement from saying half of Europe was above 100°F at once.
Why Isn’t UTCI the Same as the Temperature on a Weather App?
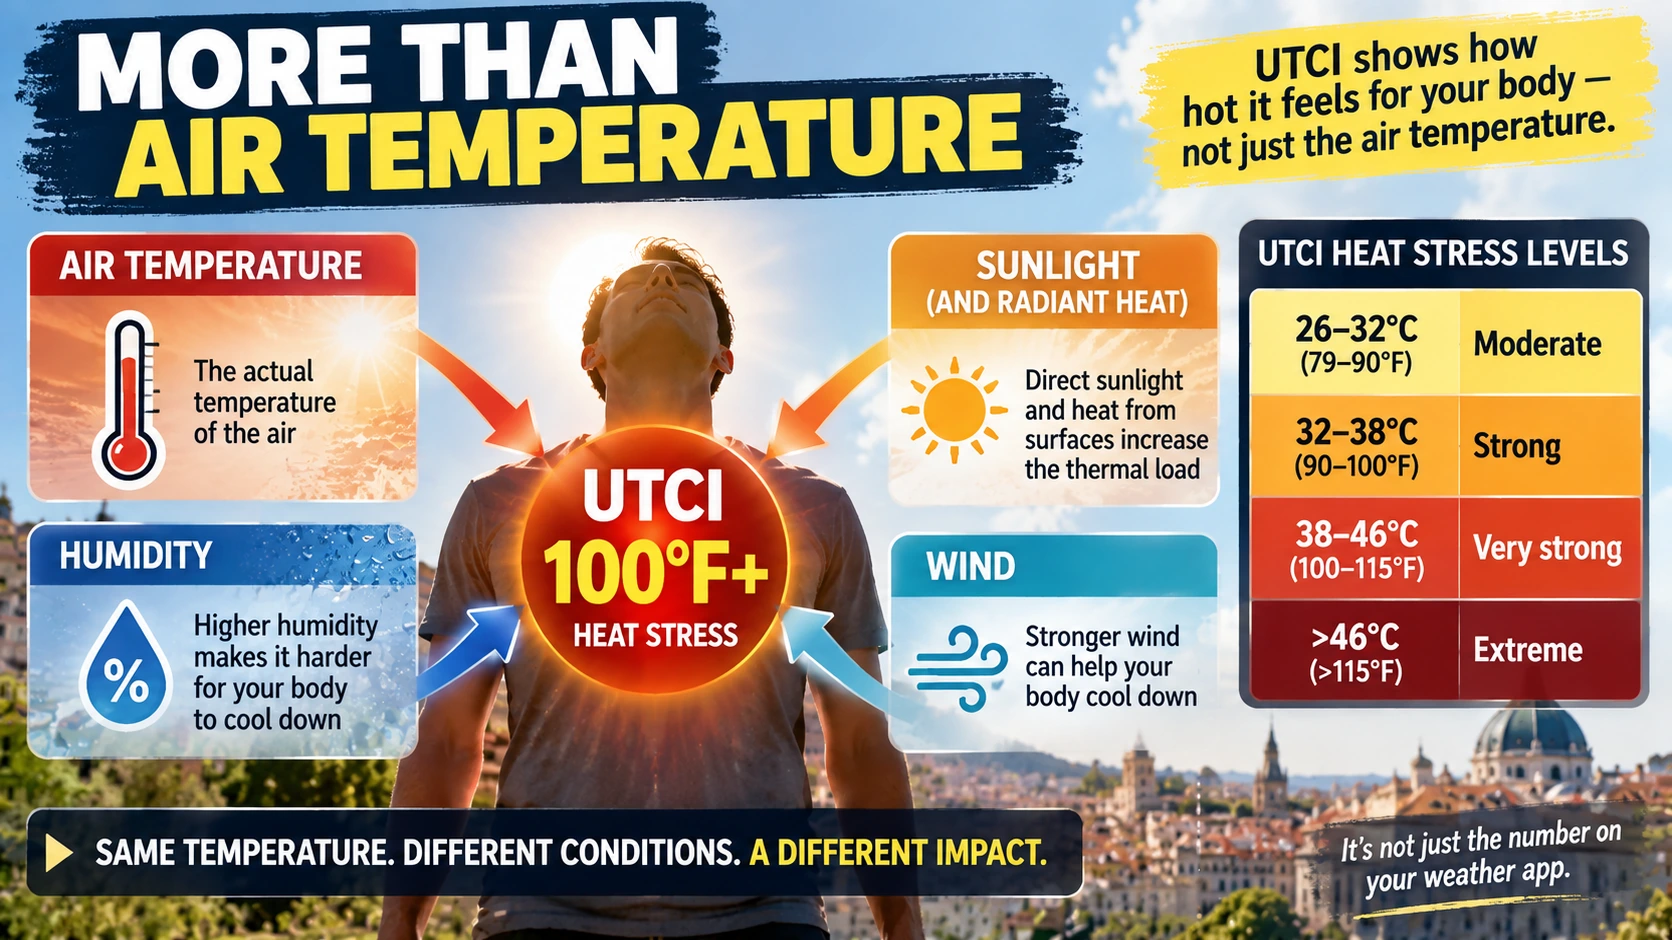
UTCI stands for Universal Thermal Climate Index. It is designed to estimate the thermal stress the outdoor environment places on the human body.
It does not use air temperature alone. It incorporates air temperature, humidity, wind speed, solar and other radiant heat, and a model of how the human body responds to those conditions. (Copernicus)
That means a UTCI reading of 100°F does not necessarily mean the thermometer showed 100°F.
Strong sunshine, weak wind, high humidity, and radiant heat can make the thermal load on the body much greater than the air temperature alone suggests.
Copernicus groups UTCI heat stress this way:
| UTCI “feels-like” range | Approx. Fahrenheit | Heat-stress category |
|---|---|---|
| 26–32°C | 79–90°F | Moderate |
| 32–38°C | 90–100°F | Strong |
| 38–46°C | 100–115°F | Very strong |
| Above 46°C | Above 115°F | Extreme |
UTCI is also not necessarily identical to the “feels like” temperature displayed by a phone weather app. Different systems can use different formulas.
The useful idea is simpler: air temperature tells you how hot the air is; UTCI tries to describe how stressful the outdoor thermal environment is for a person.
How Unusual Was Europe’s Summer of 2026?
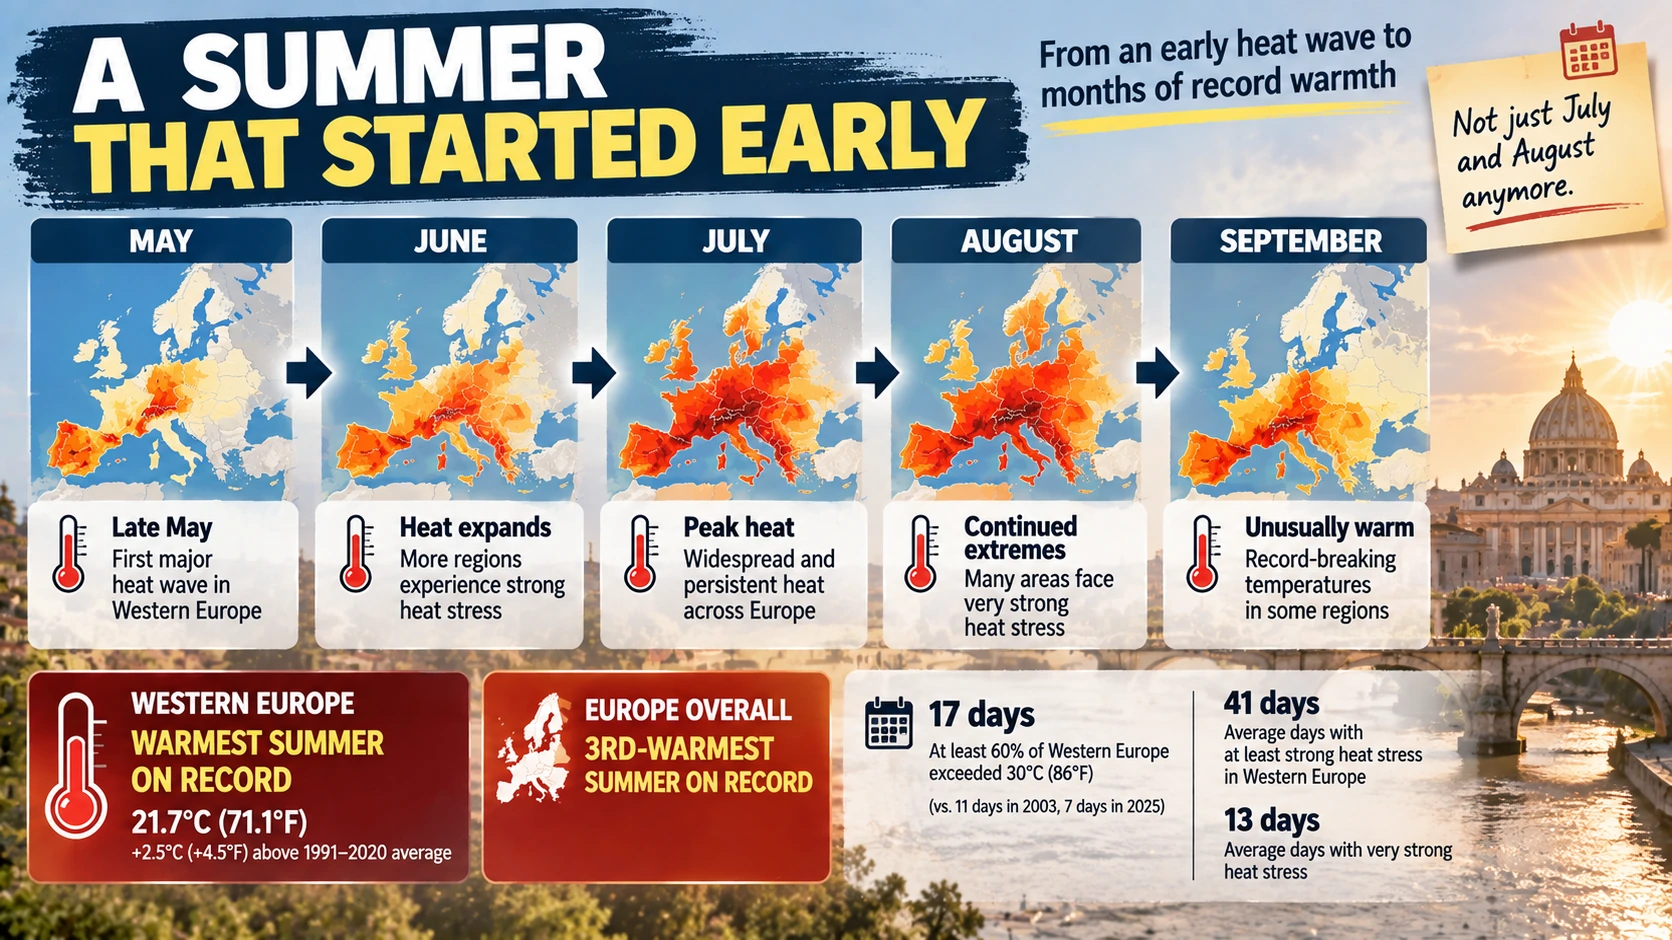
Europe as a whole had its third-warmest summer on record, according to Copernicus.
Western Europe went further: it had its warmest summer in the dataset.
The western European average for June through August was about 71.1°F (21.7°C), roughly 4.5°F (2.5°C) above the 1991–2020 average, surpassing the previous record from 2003. (Copernicus)
The season also stood out for how persistent and widespread the heat became.
| Measure | 2026 result |
|---|---|
| Europe overall | 3rd-warmest summer on record |
| Western Europe | Warmest summer on record |
| Western Europe summer average | 71.1°F / 21.7°C |
| Above 1991–2020 average | +4.5°F / +2.5°C |
| Days when at least 60% of Western Europe exceeded 86°F / 30°C | 17 |
| Western Europe average days with at least strong heat stress | 41 |
| Western Europe average days with very strong heat stress | 13 |
For comparison, the threshold of 60% of Western Europe above 86°F occurred on 11 days in 2003 and seven days in 2025.
The first major heat wave arrived unusually early, in late May, and record-breaking daily temperatures also occurred outside the traditional June-through-August summer period, including in September. (Copernicus)
So this was not mainly a story about one spectacular temperature in one city.
It was about heat that arrived early, covered a large area, and kept returning.
Why Did the Heat Become a River Problem?
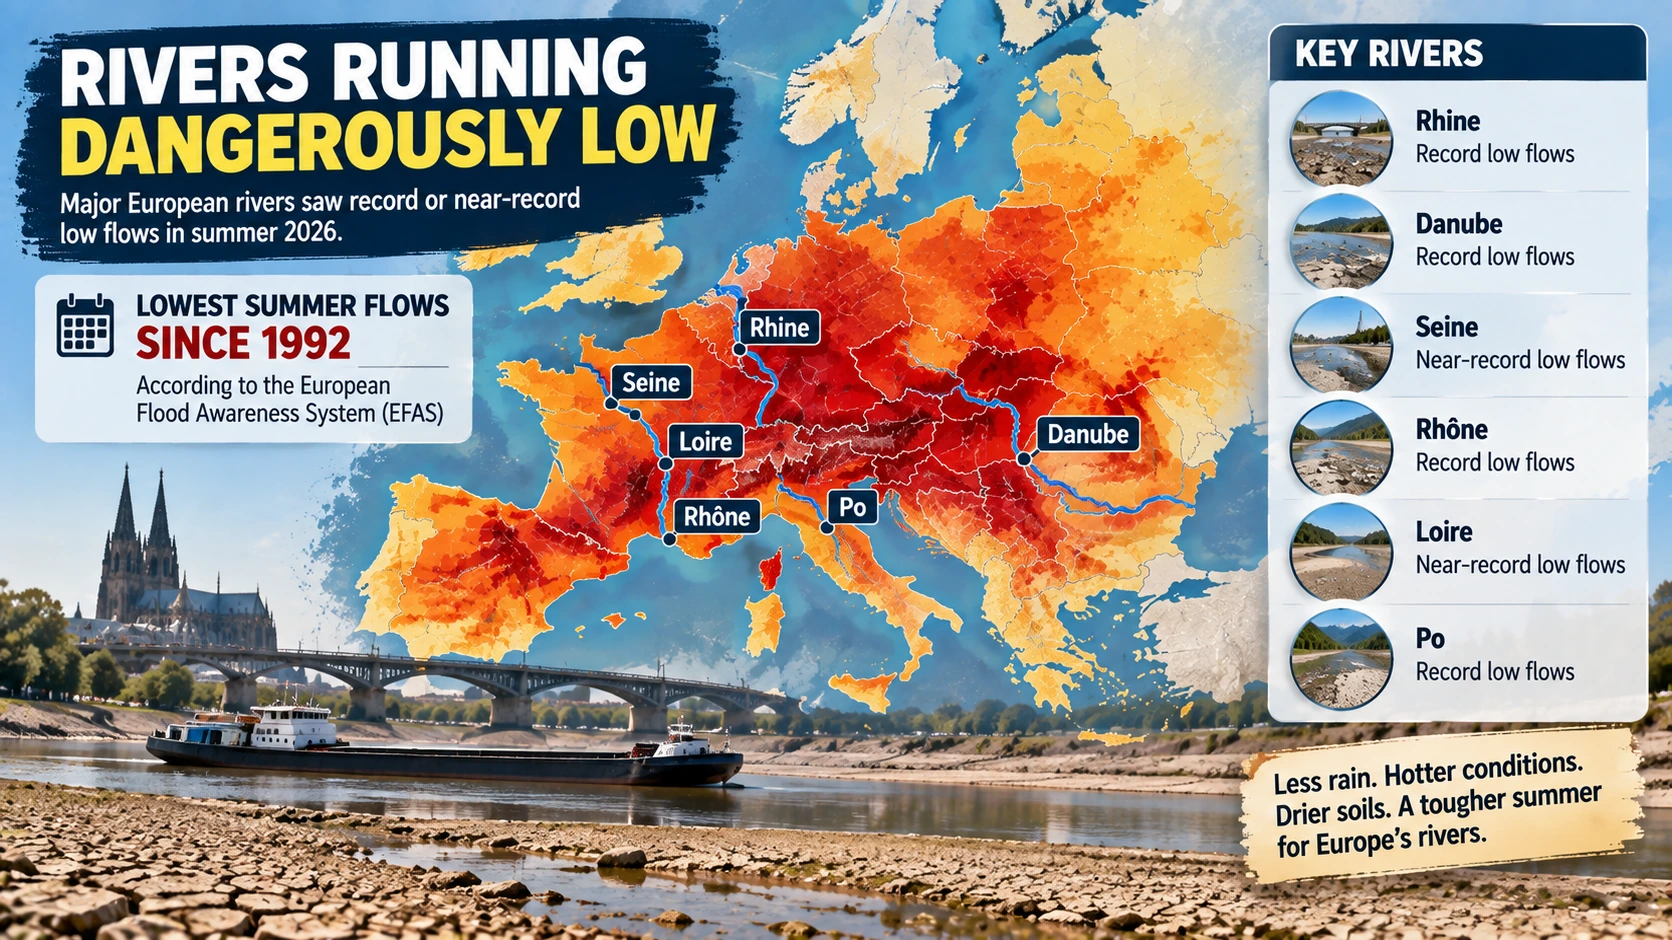
Heat was only part of the hydrological problem.
Large parts of western, central, and southeastern Europe also experienced prolonged dry conditions. When rainfall is limited and temperatures remain high, moisture is lost more quickly from soil, vegetation, reservoirs, and waterways.
Copernicus found that summer river flows across a group of major European rivers fell to their lowest level since European Flood Awareness System records began in 1992. Record or near-record low flows appeared simultaneously in July and August on major rivers including the Rhine, Danube, Seine, Rhône, Loire, and Po. (Copernicus)
It would be too simple to say the heat wave alone “dried up” Europe’s rivers.
River flow depends on rainfall, upstream inflows, snowmelt, soil moisture, groundwater, evaporation, water use, and other conditions.
But repeated heat waves occurring alongside prolonged dryness can make an existing water shortage worse.
That is why heat, drought, and low river flow became different parts of the same summer story.
Why Do Low Rivers Affect Cargo Ships, Farms, and Power Plants?
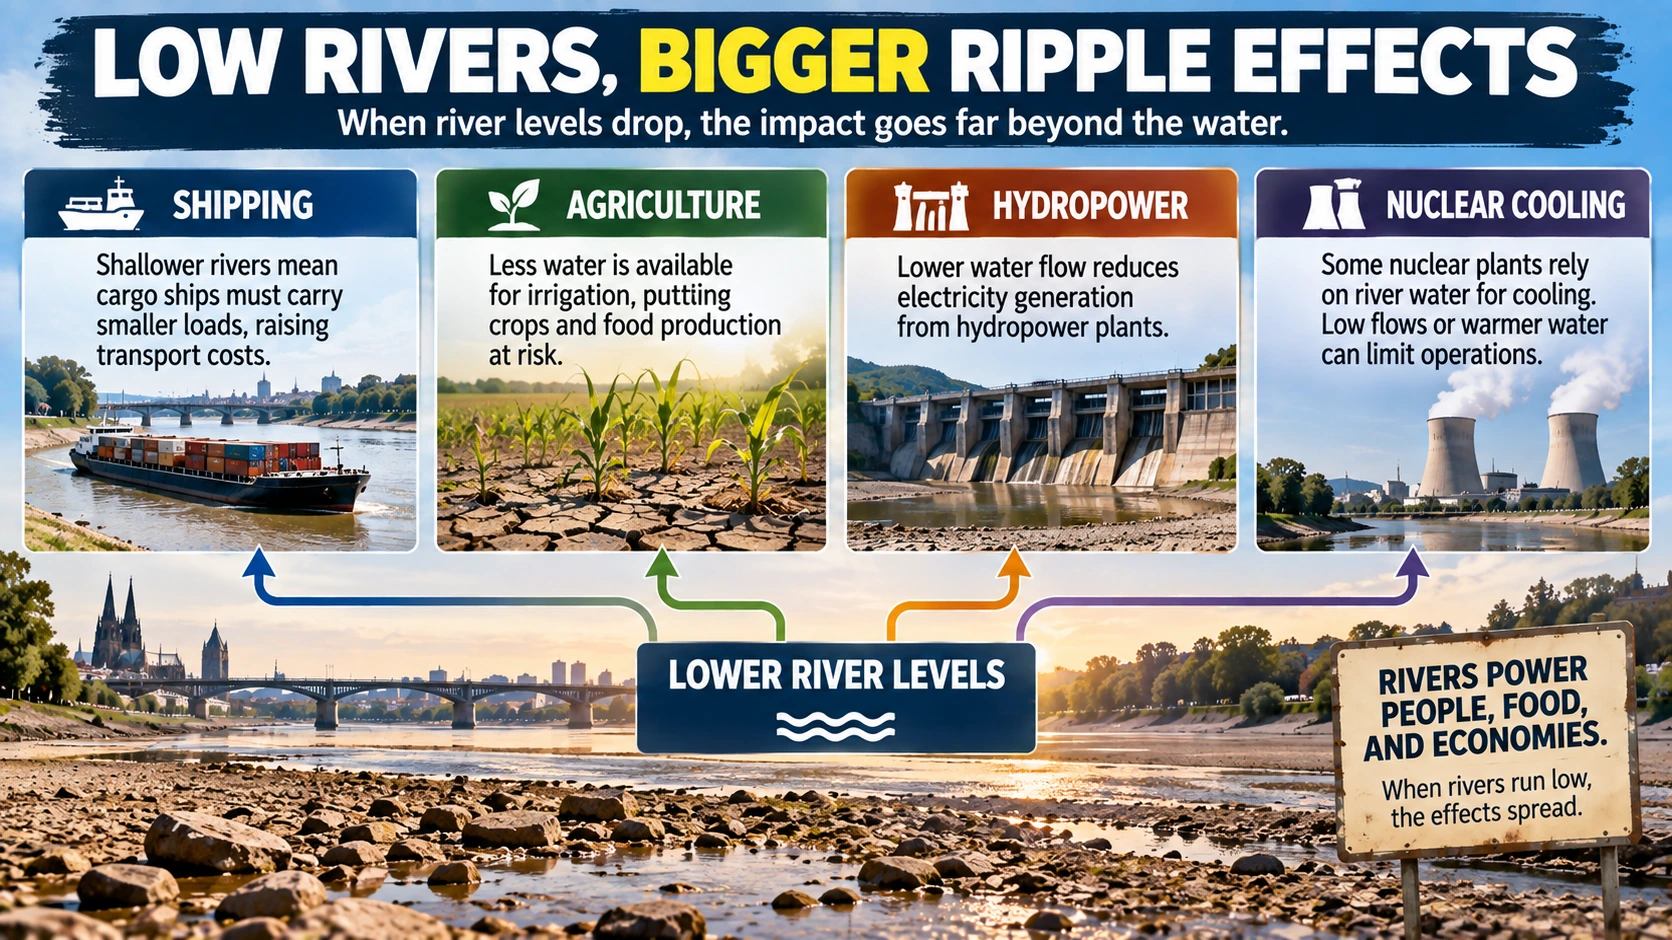
A major river is not just scenery.
In Europe, rivers such as the Rhine and Danube function as transportation corridors, water supplies, agricultural resources, and parts of the energy system.
Start with shipping.
A cargo vessel sits partly below the waterline. When a river becomes too shallow, operators may have to reduce the amount of cargo onboard so the ship rides higher and does not risk touching the riverbed.
That means the same amount of freight can require more trips, more vessels, or alternative transportation—raising costs and complicating supply chains.
Agriculture faces a different problem: less available water can restrict irrigation.
Hydropower depends directly on available water flow.
And some nuclear power plants use large quantities of river water as part of their cooling systems. Very low flows or unusually warm water can constrain how that cooling water is used.
Copernicus said Europe’s 2026 low-flow conditions placed pressure on cargo transport and supply chains, irrigation, nuclear-reactor cooling, hydropower generation, and freshwater availability. (Copernicus)
That does not mean a falling river automatically causes a power shortage or nuclear emergency.
It means water conditions can become an operating constraint for systems that normally depend on plentiful river flow.
Why Were Wildfires and Hot Seas Part of the Same Story?
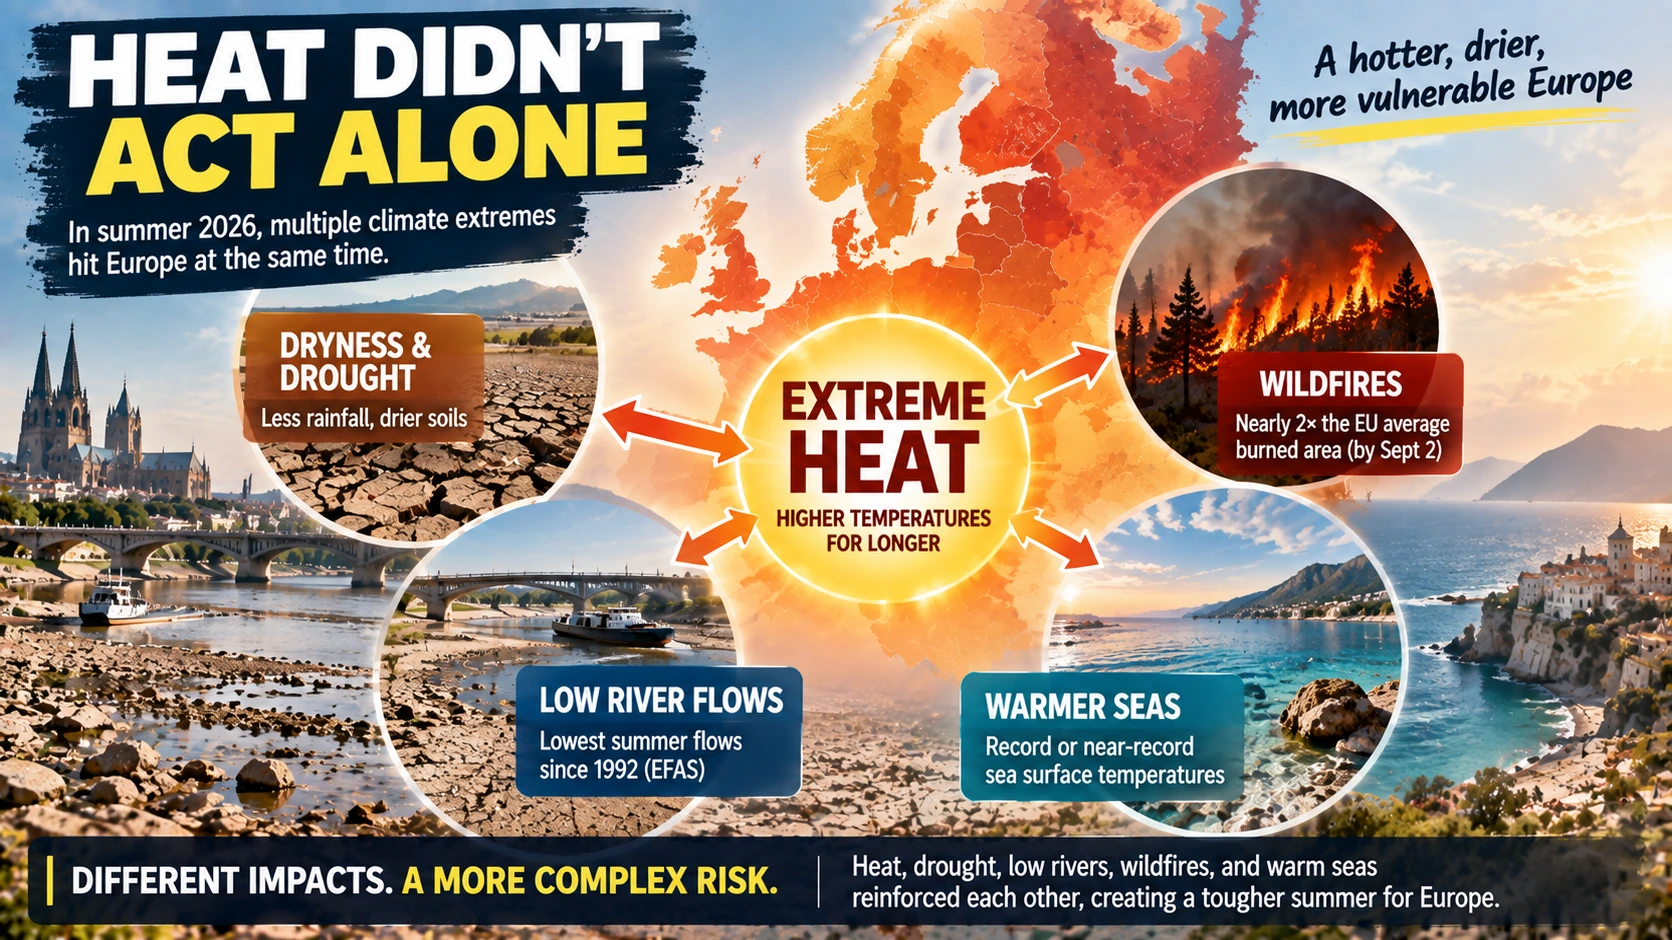
The important word here is compounding.
Different climate extremes can overlap and reinforce the pressures created by one another without being identical events or having one simple cause.
Persistent hot, dry weather can leave vegetation and soil more combustible, making it easier for fires to spread once they ignite.
By September 2, the area burned across the European Union was nearly twice the 2006–2025 average for that point in the year, with especially extensive wildfire activity in Spain and France. (Copernicus)
Europe’s surrounding seas were unusually warm as well.
Copernicus reported record or near-record sea-surface temperatures in several European waters, adding a marine component to a summer already dominated by land heat and dryness. (Copernicus European Summer Review)
So it is better to picture the summer as a network of overlapping stresses:
prolonged heat + dry conditions + low river flows + wildfire-friendly landscapes + unusually warm seas.
Those conditions did not all arise for exactly the same reason.
But when they occur together, their effects can reach far beyond the weather forecast.
Why Is Europe Warming Faster Than the Global Average?
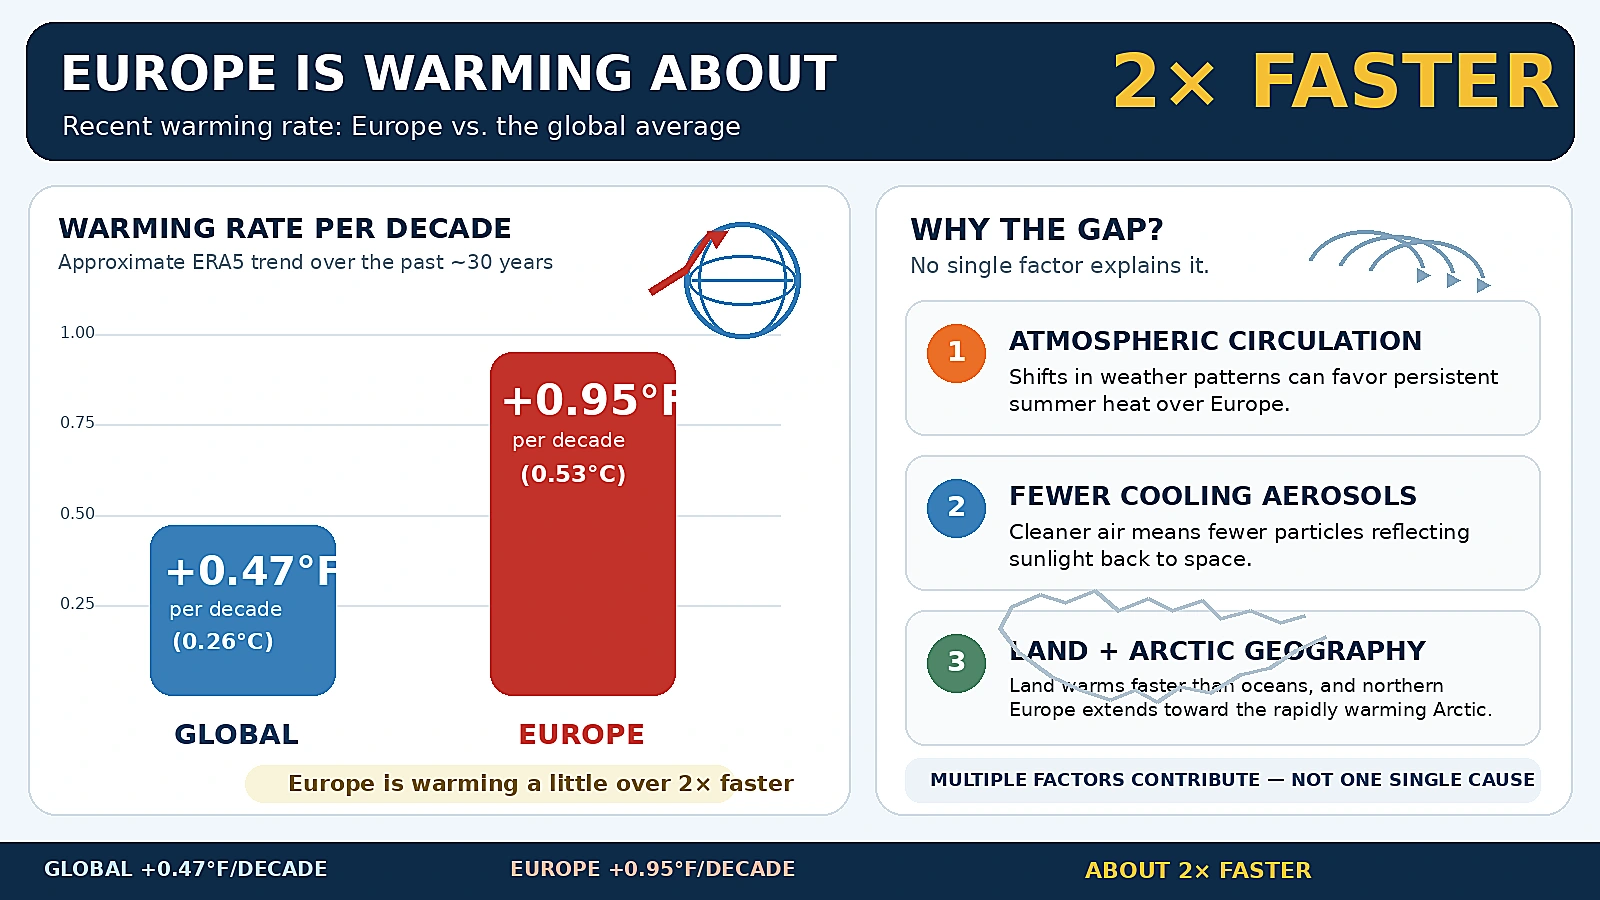
Europe’s faster warming is not a one-summer phenomenon.
Copernicus ERA5 data show that over roughly the past 30 years, the global average temperature has risen by about 0.47°F per decade (0.26°C), while European land has warmed by about 0.95°F per decade (0.53°C)—more than twice as fast. (Copernicus)
There is no single explanation.
First, land generally warms faster than oceans because oceans can absorb and redistribute large amounts of heat.
Second, shifts in atmospheric circulation can favor weather patterns associated with intense European summer heat.
Third, Europe’s successful reduction of air pollution has also changed the regional energy balance. Some aerosols once reflected sunlight and had a cooling effect. As those pollutants declined, part of that cooling influence declined as well.
And geography matters: northern Europe extends toward the Arctic, the fastest-warming region on Earth.
None of those factors means Europe will set a heat record every year.
Weather still varies enormously from one summer to another.
The point is that extreme summers are now occurring on top of a long-term warming trend that is especially strong in Europe.
What Should U.S. Travelers to Europe Watch?
For an American traveler, one useful lesson from the 52% figure is that the daily high temperature does not tell the whole story.
A forecast of 90°F can feel very different depending on direct sunlight, humidity, wind, shade, and how long you are outdoors.
The World Health Organization says hot weather can cause heat exhaustion and heat stroke and can worsen cardiovascular, respiratory, and kidney conditions. Older adults, infants, people with chronic illnesses, and people working or exercising outdoors can face greater risk. (WHO Europe)
That makes several pieces of information worth checking during a summer trip:
- Local heat warnings, not just the temperature
- How much of the day will be spent in direct sun
- Whether nighttime temperatures will provide relief
- Access to shade, water, and air conditioning
- Official local health guidance during a heat wave
And the old assumption that the worst European heat is confined neatly to July and August is becoming less reliable.
In 2026, major heat arrived in parts of western Europe in late May, while exceptional warmth also appeared in September.
What Should We Watch in Europe’s Next Heat Wave?
The biggest temperature of the day is only one number.
A more complete picture comes from watching several indicators together:
How much land is under serious heat stress?
How long does it last?
How much moisture remains in the soil?
Are major rivers losing flow?
Are wildfire conditions worsening?
Are surrounding seas unusually warm?
That combination tells us much more about potential disruption than a single record high.
Europe’s 2026 summer is a useful example because the consequences moved through several connected systems:
human heat stress → dry landscapes and water shortages → river transportation and agriculture → energy systems → wildfire and ecosystem pressure.
The important question is no longer just, “How hot did it get?”
It is, “What else starts to strain when the heat lasts this long?”
Bottom Line: What This Story Really Means
“Half of Europe felt hotter than 100°F” is an easy headline to misunderstand.
It does not mean half of Europe simultaneously had 100°F air temperatures.
It means that over the course of summer 2026, 52% of European land experienced at least one period when the UTCI—a measure of heat stress on the human body—reached 38°C, or roughly 100°F, or higher.
That was only one part of the story.
Western Europe had its warmest summer on record. Major European rivers experienced their lowest summer flows since the EFAS record began in 1992. Wildfire activity was unusually intense, and surrounding seas were exceptionally warm.
The bigger lesson from Europe’s summer is therefore not one temperature record.
It is how sustained heat can become a health, water, transportation, agriculture, energy, and ecosystem problem at the same time.
Europe Heat Stress: Key Questions Explained
Q. Did 52% of Europe experience 100°F heat at the same time?
No. The 52% figure is cumulative. It means 52% of European land experienced UTCI heat stress of at least 38°C, or about 100°F, at least once during summer 2026, not simultaneously.
Q. Does a UTCI reading of 100°F mean the air temperature was 100°F?
Not necessarily. UTCI combines air temperature with humidity, wind, solar radiation, and other radiant heat to estimate thermal stress on the human body.
Q. What is considered “very strong heat stress”?
Copernicus classifies UTCI values from 38°C to 46°C, or roughly 100°F to 115°F, as very strong heat stress. Above 46°C, or about 115°F, is classified as extreme heat stress.
Q. Was 2026 Europe’s hottest summer ever?
Not for Europe as a whole. Europe had its third-warmest summer on record, while Western Europe had its warmest summer on record, averaging about 71.1°F (21.7°C).
Q. Were Europe’s rivers really at record-low levels?
Summer flows across major European rivers were the lowest in the EFAS record, which begins in 1992. The Rhine, Danube, Seine, Rhône, Loire, and Po were among the rivers with record or near-record low flows during July and August.
Q. Why does low river flow affect cargo shipping?
Shallower water limits how deeply a cargo vessel can sit in the river. Operators may have to carry lighter loads, which can require more trips and raise transportation costs.
Q. Can low river levels affect electricity production?
Yes. Low river flow can reduce hydropower output and place constraints on cooling-water availability for some thermal and nuclear power plants. That does not mean low water automatically causes a shutdown or nuclear emergency.
Q. Why is Europe warming faster than the global average?
Europe has warmed at more than twice the global average rate in recent decades. Factors include the tendency of land to warm faster than oceans, changes in atmospheric circulation, reduced aerosol pollution, and Europe’s geographic connection to the rapidly warming Arctic.
Q. Should travelers look at more than the daily high temperature?
Yes. Heat stress can depend on humidity, sunlight, wind, nighttime temperatures, and how long a person is exposed outdoors. Local heat warnings and public-health guidance can provide more useful information than the high temperature alone.
Did this help make the story clearer? 🙂 WIN keeps unpacking the “why” behind the news—clearly and simply!
Sources
Summer 2026 Heat, River Flows, and Wildfires
Copernicus — Record heat stress and low river flows marked Europe’s 2026 summer
Copernicus — European summer 2026: records, extremes and context
Reuters — Half of Europe faced very strong heat stress this summer, EU scientists say
UTCI and Europe’s Long-Term Warming
Copernicus — Heat stress: what is it and how is it measured?
Copernicus — Thermal Trace: Decades of heat and cold stress data at your fingertips
Copernicus — Why are Europe and the Arctic heating up faster than the rest of the world?