
Why Are U.S. Pending Home Sales at a Record Low Even as Listings Rise?

If there are more homes for sale, shouldn’t buying a house be getting easier?
That’s what many Americans might expect. More listings should mean more choices, less competition, and perhaps a better chance of negotiating a deal.
Yet the latest U.S. housing figures tell a different story.
On October 20, 2026, the National Association of Realtors reported that pending home sales had plunged 7.3% in September. The index tracking newly signed contracts fell to its lowest level since the series began in 2001. (NAR · Reuters)
The surprising part? Homes are becoming more plentiful in many markets, and sellers are increasingly cutting asking prices.
The problem isn’t simply a shortage of houses. It’s that the monthly cost of buying one has become too expensive for many potential buyers.
That distinction helps explain why additional inventory hasn’t translated into more signed contracts—and why a record low in homebuying activity doesn’t automatically mean home prices are collapsing.

※ Images in this article are AI-generated illustrations created to help explain the story. They are not actual photographs, and depictions of people, places, or events may differ slightly from reality.
What Does a Record Low in Pending Home Sales Actually Mean?
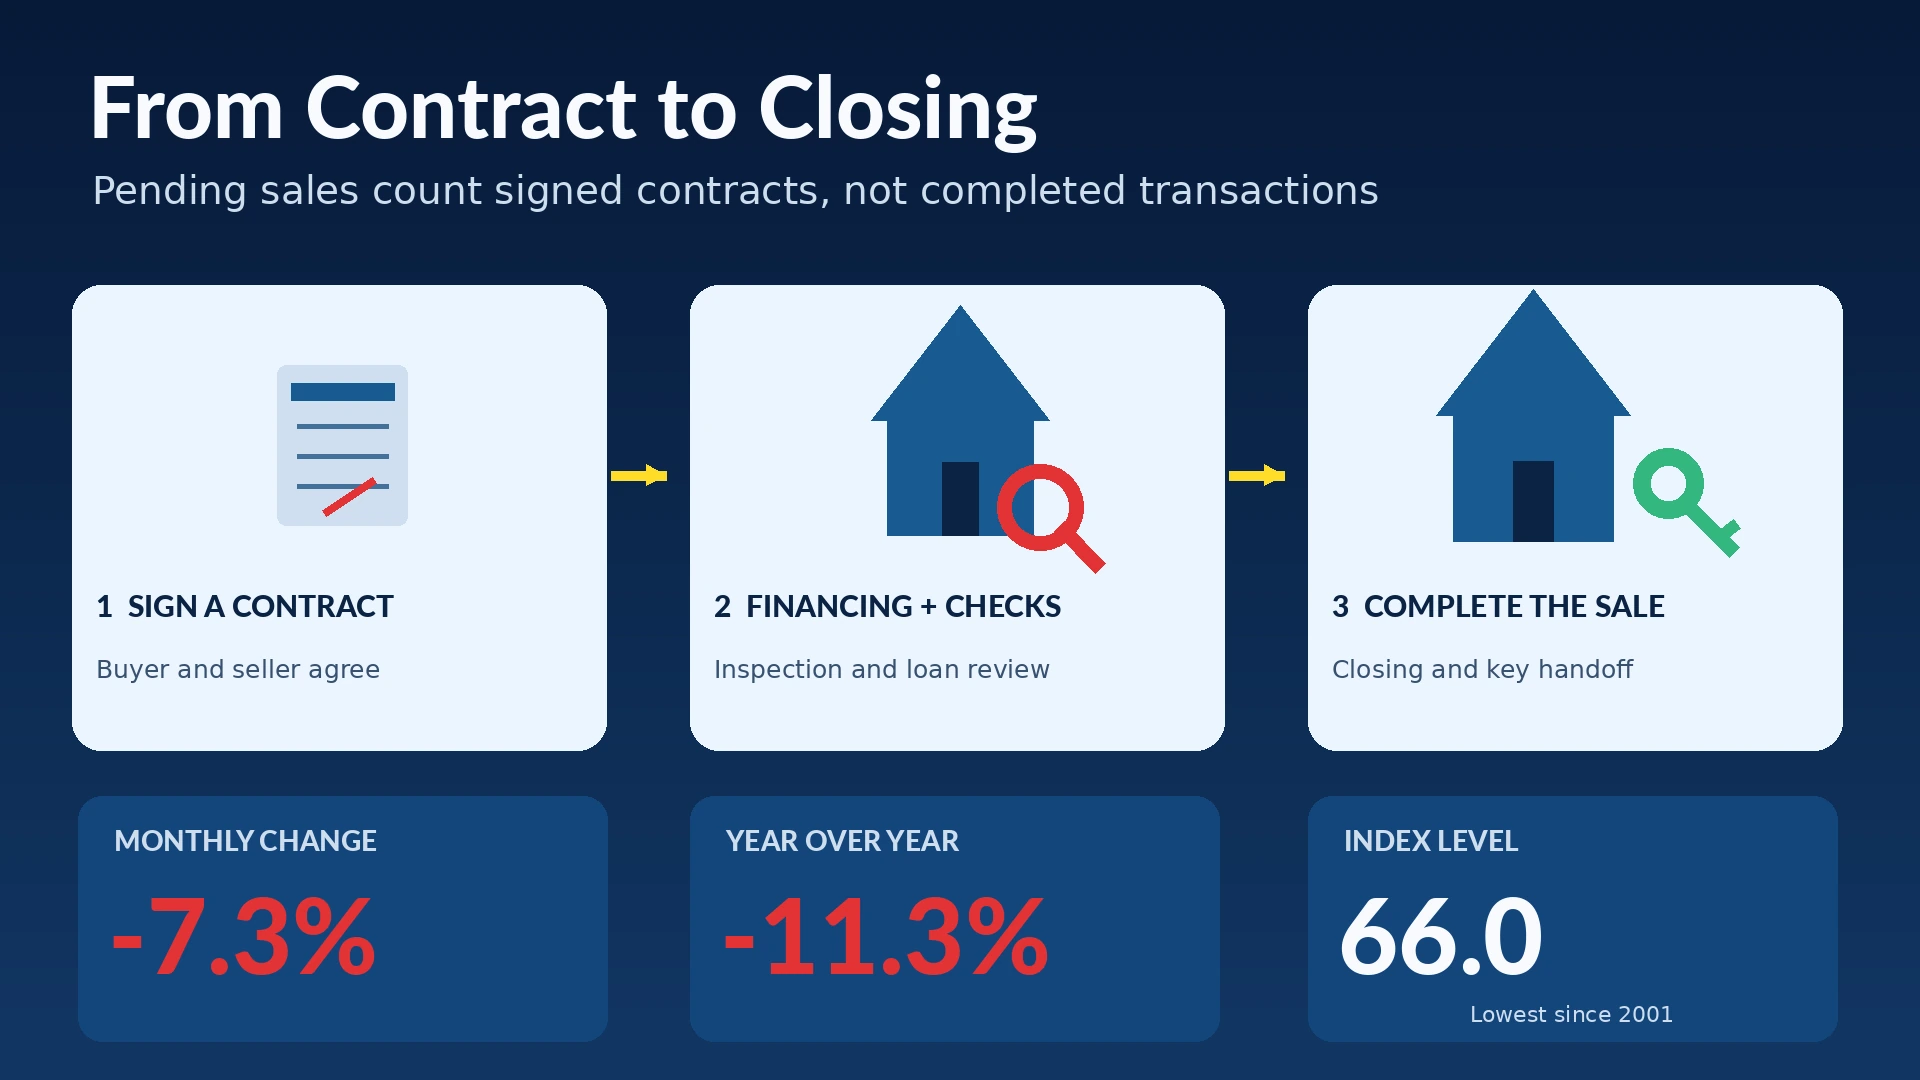
Pending home sales measure signed purchase contracts, not completed home purchases. That makes the latest decline an early warning about housing demand rather than a count of homes that have already changed hands.
The National Association of Realtors (NAR) reported three important figures for September 2026:
- Pending sales fell 7.3% from August.
- Contract activity was 11.3% below September 2025.
- The Pending Home Sales Index fell to 66.0, its lowest reading in records dating back to 2001.
All four major U.S. regions reported declines. (NAR · Reuters)
Why does the difference between a contract and a completed sale matter?
Imagine someone signs a contract to purchase a home in September. The buyer still needs to finalize financing, complete inspections, and eventually close the transaction.
That closing might happen in October or November.
Pending home sales capture the earlier step: the signed contract. Existing-home sales statistics generally capture the later step: the completed transaction.
That’s why pending sales often provide a preview of where completed sales could be heading over the next month or two.
The index itself is also easy to misunderstand.
A reading of 66.0 doesn’t mean exactly 66 homes were sold or that prices fell by 34%. The index uses 2001 contract activity as a baseline of 100, allowing researchers to compare activity over time.
And because the September number is a seasonally adjusted measure, the 7.3% monthly decline isn’t merely a reflection of summer ending.
It signals a significant drop in the pace of buyers signing contracts.
Why Did Rising Mortgage Rates Stop So Many Buyers?
Higher mortgage rates increase the monthly payment on a home, even when the asking price stays exactly the same.
That can push a property beyond a buyer’s budget almost overnight.
Freddie Mac’s weekly survey showed how quickly borrowing conditions changed in late summer and fall 2026:
| Survey date | Average 30-year fixed mortgage rate |
|---|---|
| August 27, 2026 | 6.66% |
| September 3, 2026 | 6.71% |
| September 24, 2026 | 7.03% |
| October 15, 2026 | 7.40% |
The October 15 figure was the highest weekly average in nearly three years. It was also well above the 6.27% rate recorded around the same time one year earlier. (Freddie Mac · AP)
How much can that increase add to a monthly payment?
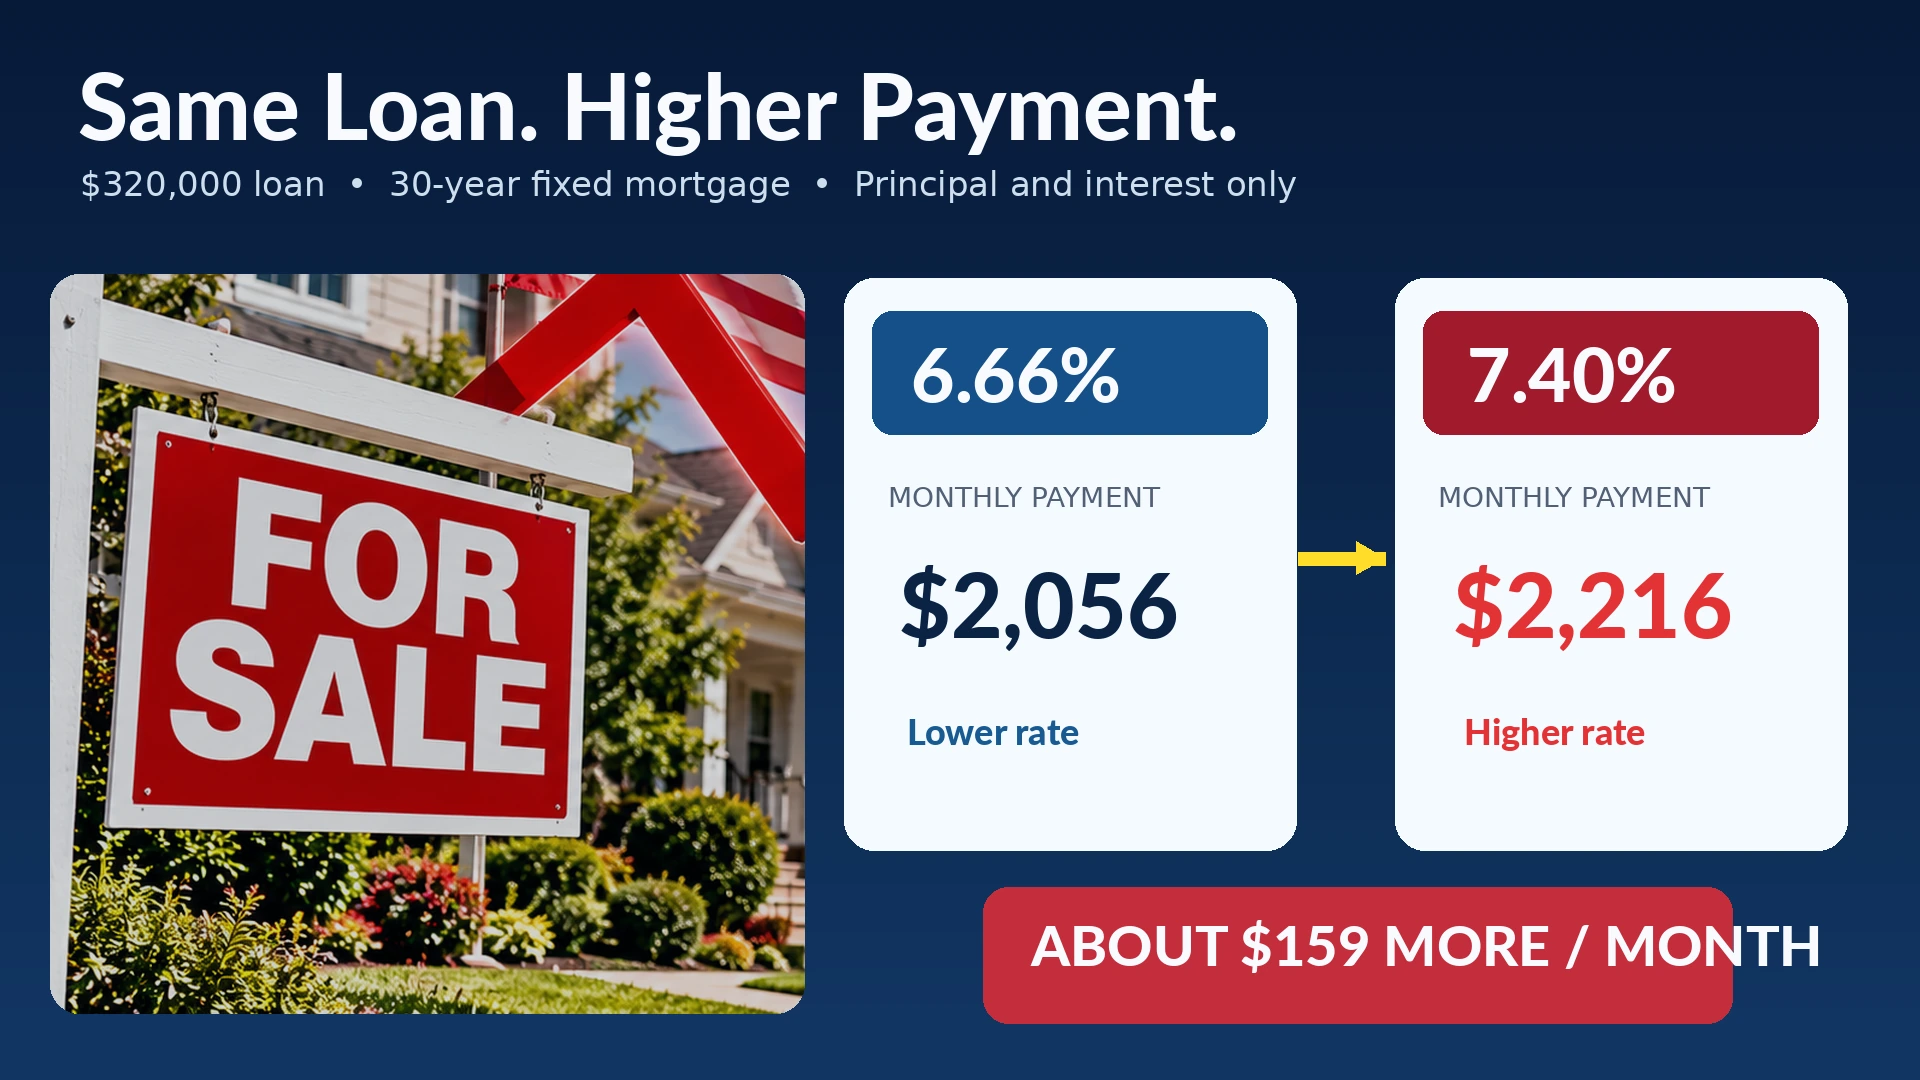
Consider a hypothetical $400,000 home with a 20% down payment.
The buyer would borrow $320,000 through a 30-year fixed-rate mortgage.
| Mortgage rate | Monthly principal and interest |
|---|---|
| 6.66% | About $2,056 |
| 7.40% | About $2,216 |
| Difference | About $159 more per month |
That’s roughly $1,910 more per year for the same loan amount.
These are illustrative calculations comparing Freddie Mac’s August 27 and October 15 weekly rates, not actual loan offers or an average mortgage rate for September. They exclude property taxes, homeowners insurance, homeowners association fees, and other expenses.
The effect can be especially painful for first-time buyers.
Someone who had barely qualified for a mortgage at the lower rate might no longer satisfy a lender’s debt-to-income requirements at the higher rate. Others may still qualify but decide that the monthly payment leaves too little room for savings, childcare, or emergencies.
The house hasn’t necessarily become more expensive on paper. The financing has made it less affordable.
Why doesn’t the Federal Reserve control mortgage rates directly?
The Federal Reserve sets a benchmark short-term interest rate, but 30-year mortgage rates are influenced heavily by longer-term bond yields, inflation expectations, and lending-market conditions.
When investors expect inflation to remain elevated, longer-term borrowing costs can rise—even if the Federal Reserve’s next move is uncertain.
That’s important in the current housing market because rising energy prices and inflation concerns have added pressure to longer-term rates.
NAR chief economist Lawrence Yun has suggested mortgage rates could be approaching a peak, but he also emphasized uncertainty surrounding energy prices and inflation. That is a possibility, not a confirmed turning point. (NAR)
If More Homes Are for Sale, Why Aren’t More Buyers Showing Up?
A larger supply of homes doesn’t necessarily create more buyers. When financing becomes too expensive, listings can accumulate because fewer shoppers are willing or able to complete a purchase.
That’s what makes the latest housing numbers so unusual.
According to Realtor.com’s September 2026 housing report, active home listings increased to approximately 1.16 million, up 5.4% from a year earlier.
At the same time, 20.8% of listings had a price reduction during September, the highest monthly share since October 2022. (Realtor.com)
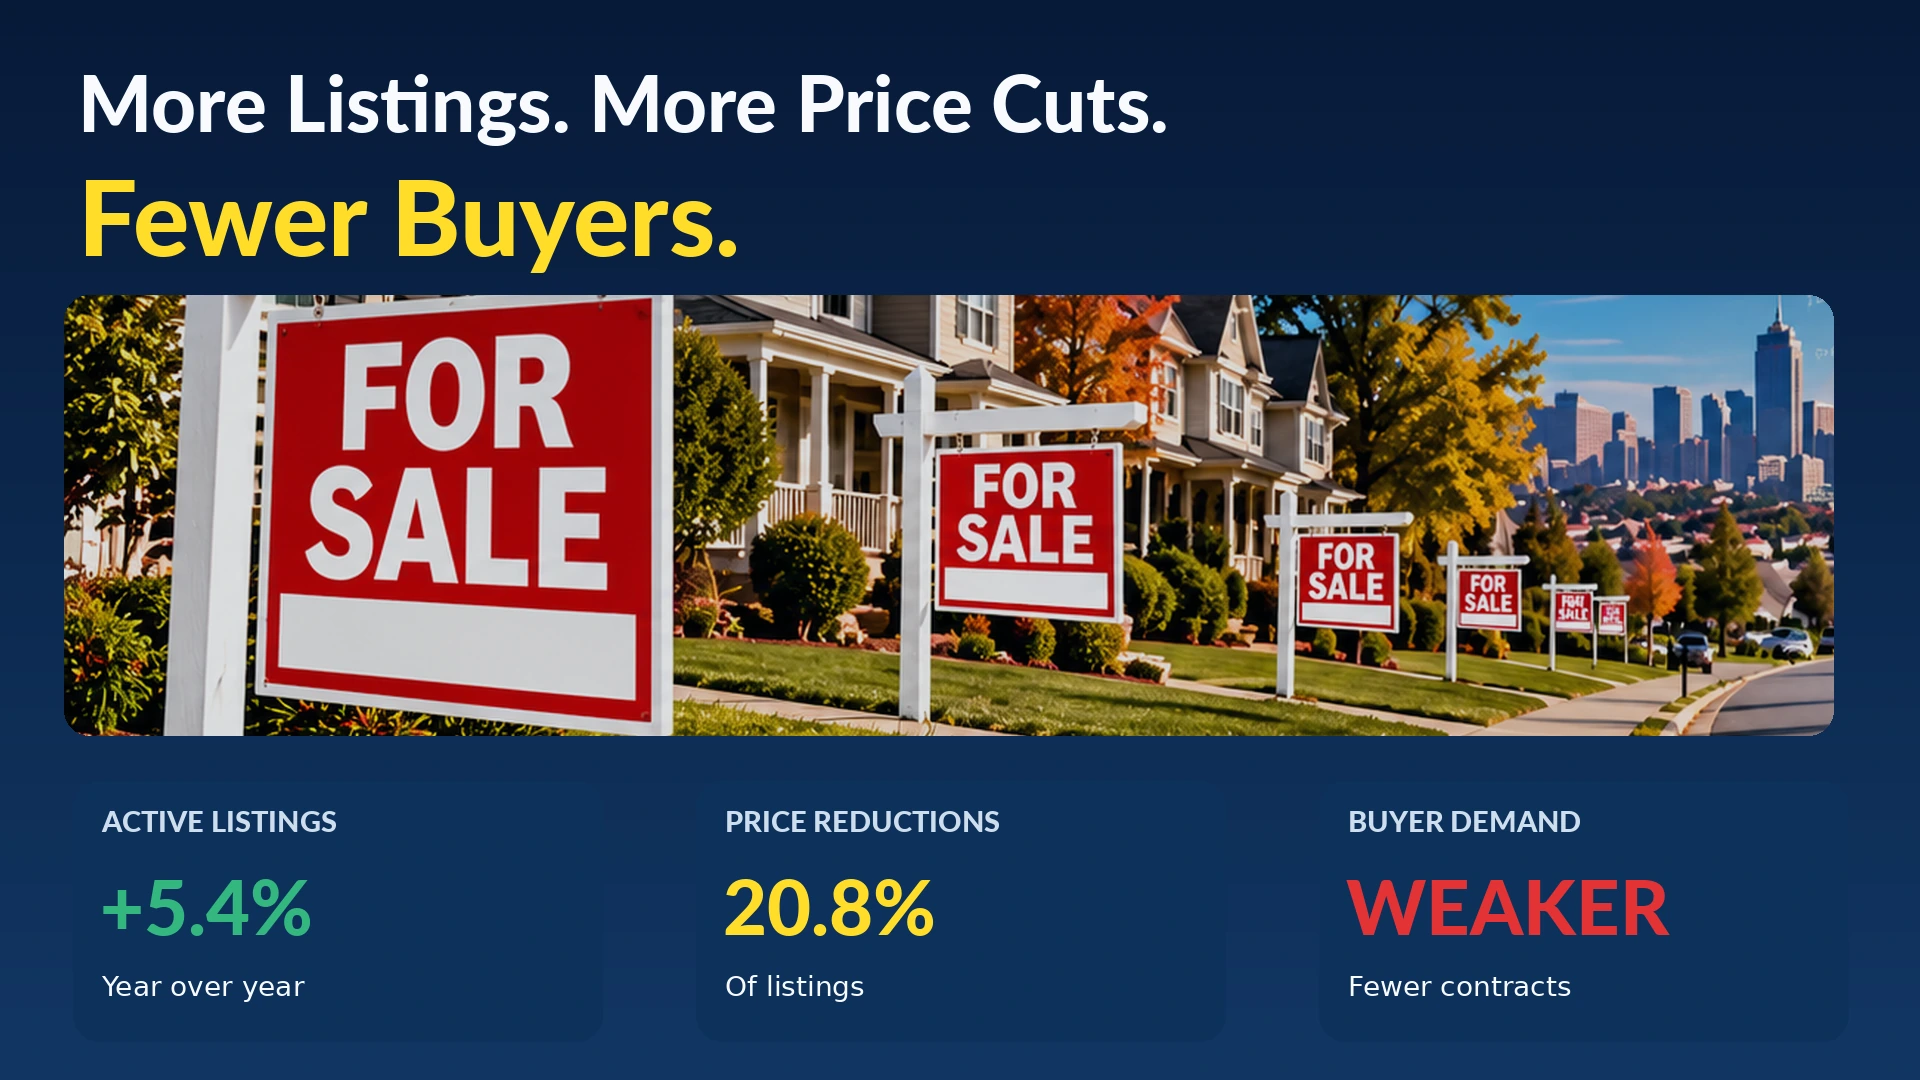
A home listed for sale represents potential supply. But a buyer needs more than interest in the property. They need sufficient income, financing, and confidence that the purchase makes financial sense.
If fewer households meet those conditions, homes can remain on the market longer.
This can create a cycle:
- Mortgage rates rise, reducing the number of qualified buyers.
- Fewer buyers sign contracts.
- Listings remain active instead of moving into completed sales.
- Some sellers cut prices or offer concessions.
- Buyers may still hesitate if the total monthly cost remains too high.
Even a lower asking price may not fully offset a higher mortgage rate.
And there’s another important distinction: Realtor.com’s active-listing data and NAR’s pending-contract index use different datasets and measure different things. They illustrate the same broader imbalance, but their percentage changes should not be treated as directly comparable transaction counts.
Which Parts of the United States Are Seeing the Biggest Declines?
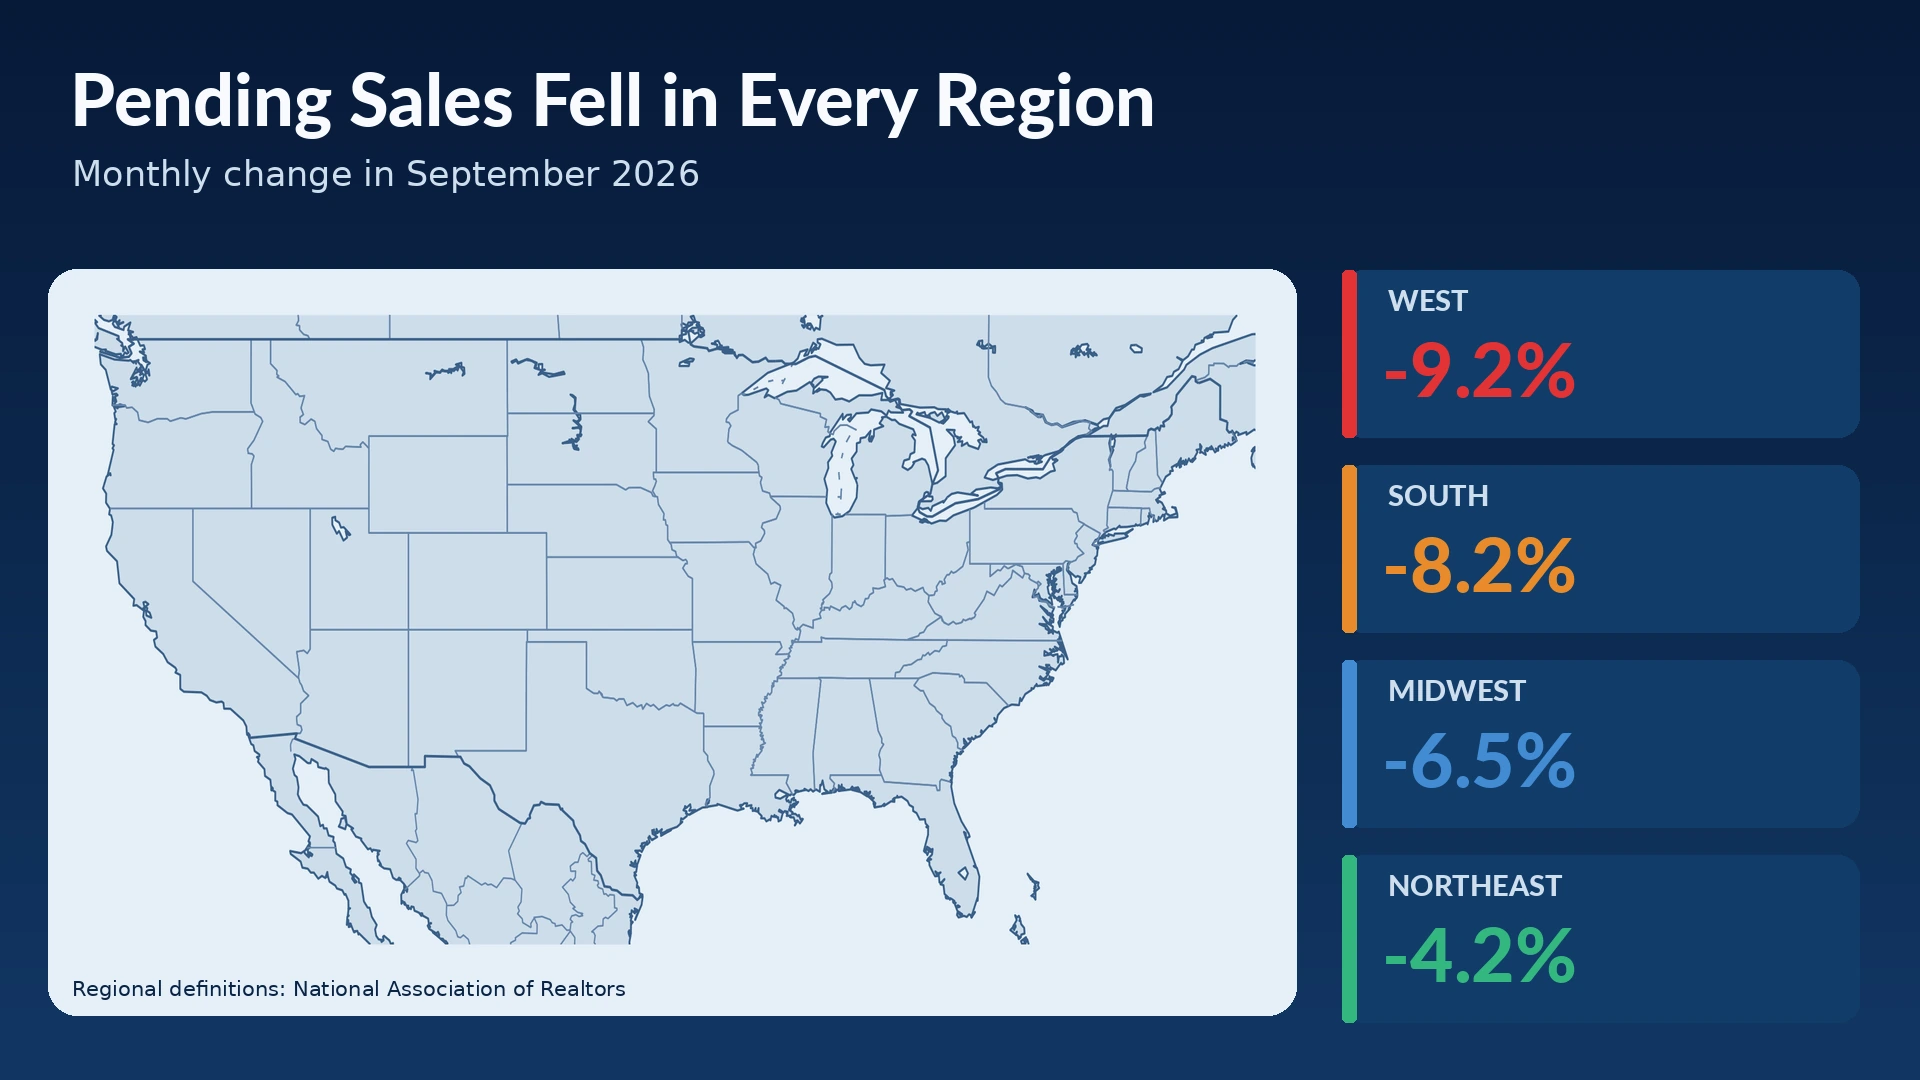
The West experienced the sharpest monthly decline in pending home sales, followed by the South. But every major U.S. region weakened in September.
The NAR report provides a clearer picture of how widely the slowdown has spread.
| U.S. region | Monthly change | Annual change |
|---|---|---|
| Northeast | -4.2% | -9.4% |
| Midwest | -6.5% | -8.7% |
| South | -8.2% | -12.0% |
| West | -9.2% | -15.0% |
(NAR)
The regional differences matter because there isn’t one uniform American housing market.
Mortgage rates are important nationwide, but local home prices, property taxes, job conditions, housing supply, and household incomes determine how affordable a particular city or neighborhood feels.
A relatively affordable Midwestern market can behave quite differently from an expensive coastal city.
Even within the same region, one neighborhood may attract multiple offers while another sees listings sitting unsold for weeks.
National statistics identify the pressure. Local conditions determine how that pressure affects an individual purchase.
If Home Sales Are at a Record Low, Why Haven’t Prices Collapsed?
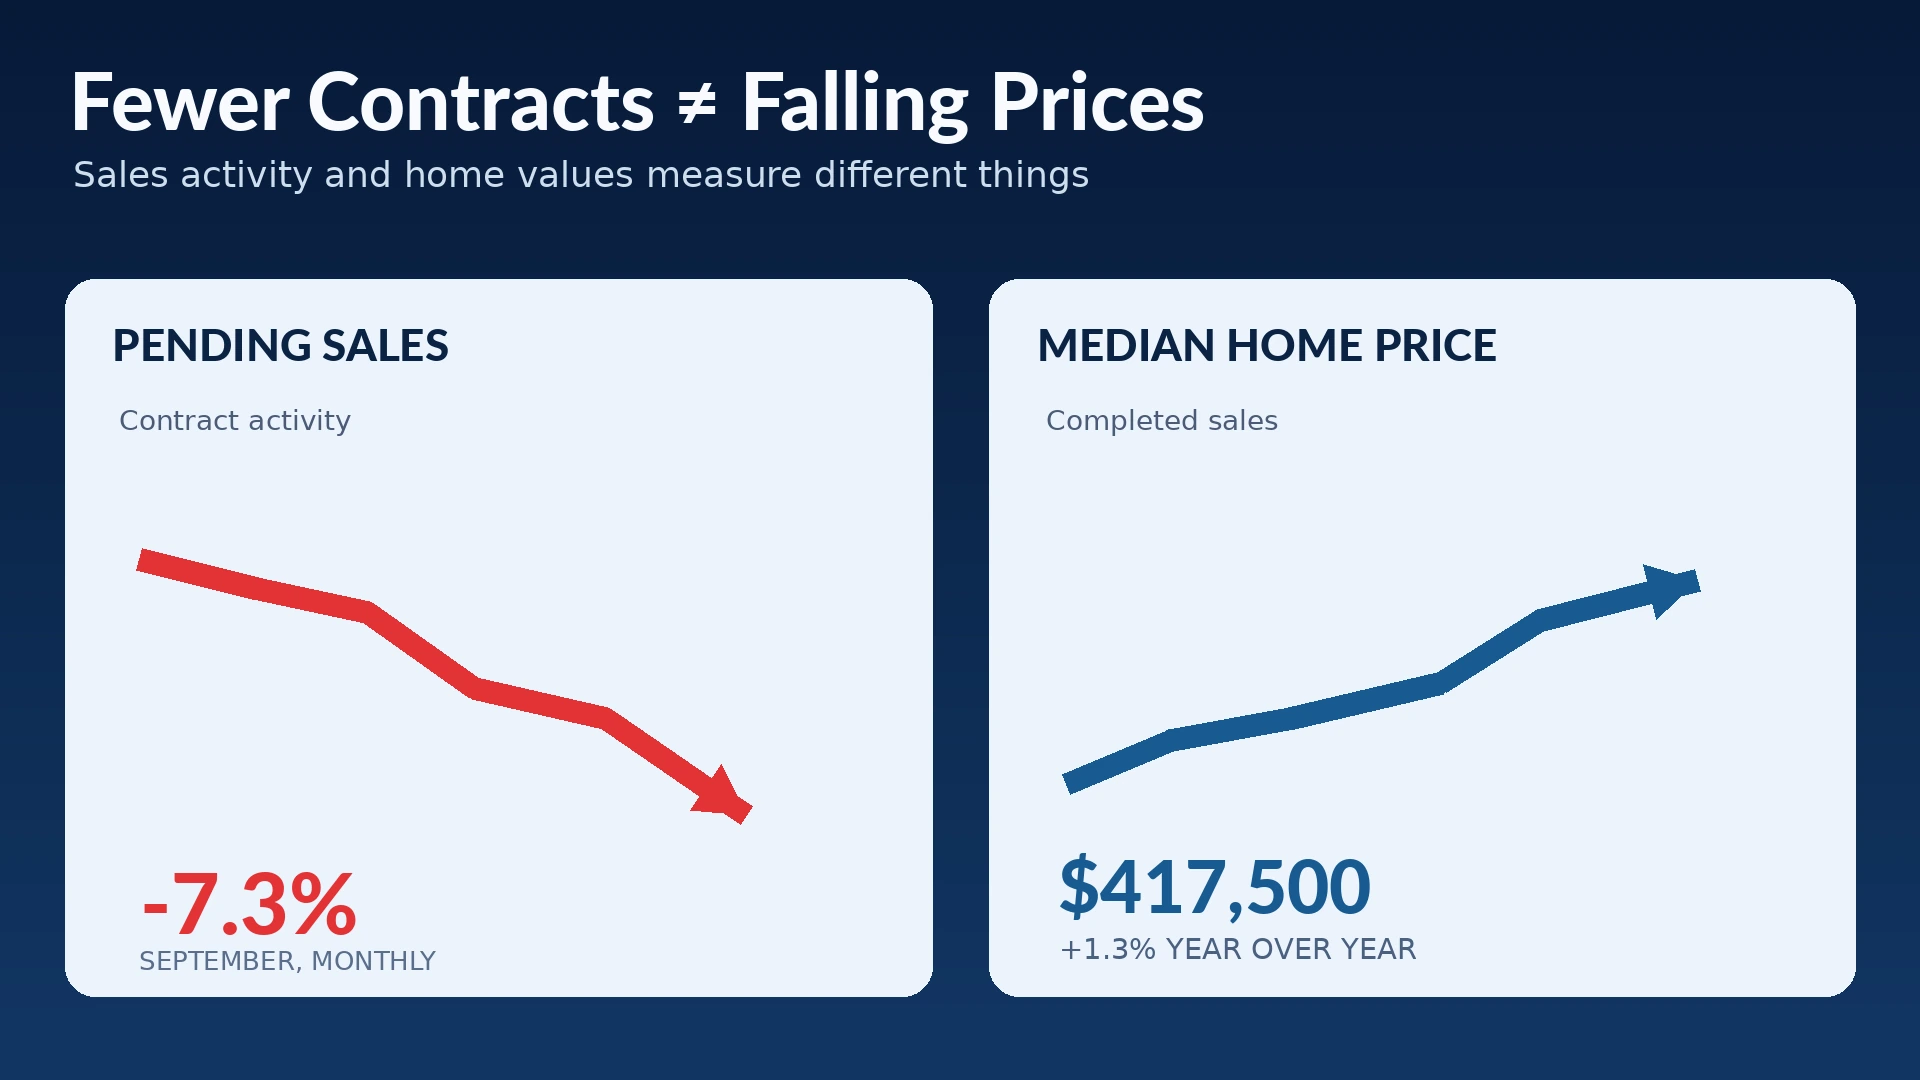
A record low in pending sales is not the same as a record low in home prices. The two measures can move in different directions because fewer transactions don’t automatically mean sellers are desperate to accept much lower offers.
September’s data illustrate that difference.
NAR reported that completed existing-home sales actually increased 1.5% from August, even as pending contracts fell sharply. The median price of existing homes sold was $417,500, up 1.3% from a year earlier. (NAR)
Meanwhile, Realtor.com reported that the median listing price was down 1.4% year over year in September. (Realtor.com)
Those figures aren’t contradictory. One tracks prices of homes that completed sales; the other tracks asking prices for homes advertised for sale. The properties and measurement methods differ.
Why might some sellers resist lowering prices?
Many homeowners aren’t forced to sell immediately.
Some may have substantial home equity, stable employment, or older mortgages with much lower interest rates. Moving could mean giving up favorable financing and accepting today’s higher borrowing costs.
For those households, staying put may be more attractive than selling at a discount.
NAR’s chief economist has also pointed to the limited number of distressed properties as one reason home prices have remained comparatively steady despite weak demand. (NAR)
That doesn’t mean every homeowner can afford to wait, or that prices cannot fall. It means a weak sales market doesn’t automatically create the widespread forced selling associated with a major housing crash.
A market can remain slow for an extended period while buyers and sellers disagree about what homes are worth.
Are Homebuilders Seeing the Same Warning Signs?
New residential construction also showed weakness in September, suggesting the housing slowdown extends beyond existing-home transactions.
On October 20, the U.S. Census Bureau reported that privately owned housing starts were running at a seasonally adjusted annual rate of approximately 1.221 million units in September, down an estimated 5.2% from August.
Building permits were running at an annual rate of approximately 1.400 million, down 0.2% from the previous month. (U.S. Census Bureau)
Housing starts refer to the beginning of physical construction, not the number of homes sold. Building permits measure authorizations for future construction activity.
The Census Bureau also reports substantial sampling uncertainty around monthly construction changes, so the September decline in starts alone should not be interpreted as proof of a sustained downward trend.
Still, the construction figures add another dimension to the market’s difficulties.
If builders anticipate weak demand, they may become more cautious about starting new projects.
That creates a longer-term problem. Slower construction can help prevent an immediate buildup of unsold new homes, but it may also limit future housing supply when affordability eventually improves.
In other words, weak demand today doesn’t automatically solve America’s underlying housing affordability problem.
What Does This Mean for People Trying to Buy or Sell a Home?
For buyers who can qualify for financing, weaker demand may create better negotiating opportunities. For sellers, accurate pricing and flexibility are becoming more important.
But neither side should assume that a national slowdown guarantees a particular outcome in their local market.
For homebuyers: More negotiating power doesn’t erase borrowing costs
A home that has remained on the market for weeks may offer room to negotiate on price, repairs, closing costs, or mortgage-rate buydowns.
Before making an offer, buyers should distinguish between a lower purchase price and a lower total monthly cost.
The interest rate, down payment, property taxes, insurance, maintenance, and any association fees all affect affordability.
Buyers should also compare actual lender quotes rather than assuming the national mortgage-rate average is the exact rate available to them.
A temporary rate buydown may help with early payments, but buyers need to understand when the rate increases and whether they can afford the payment afterward.
For sellers: Yesterday’s market may no longer determine today’s price
A homeowner may remember what a neighbor’s property sold for during a stronger market.
But the pool of buyers willing and able to pay that price may have changed.
Some sellers may benefit from adjusting their asking price or offering meaningful concessions. Others may decide that waiting is financially preferable.
The right decision depends on local competition, the property’s condition, carrying costs, and how urgently the owner needs to move.
The central difficulty is that buyers and sellers are reacting to different financial pressures: buyers focus on what they can afford each month, while sellers focus on how much value they believe their homes should retain.
What Could Finally Bring U.S. Homebuyers Back?
A sustained recovery would likely require some combination of more affordable mortgage rates, stronger purchasing power, and home prices that better match household budgets.
A modest decline in rates could bring some buyers back into the market, particularly those who remain close to mortgage-qualification limits.
But lower borrowing costs alone would not guarantee a recovery. If home prices rise again or available inventory remains concentrated in expensive locations, affordability could continue to frustrate buyers.
There are several developments worth following.
Mortgage rates and inflation
Lower inflation expectations and falling longer-term bond yields could eventually ease mortgage rates. The timing remains uncertain, and changes in Federal Reserve policy do not translate automatically into identical changes in 30-year mortgage rates.
Pending sales versus completed sales
Because signed contracts usually precede closings by several weeks, a sustained decline in pending sales may eventually appear in completed sales statistics.
This helps explain why September’s completed existing-home sales rose slightly even as newly signed contracts dropped sharply.
Inventory and actual sale prices
More listings can improve buyer choice, but the direction of local prices will depend on how quickly homes sell, how much sellers negotiate, and whether the supply of distressed properties changes.
The next scheduled NAR reports provide useful checkpoints: October existing-home sales on November 12, 2026, followed by October pending home sales on November 18, 2026. (NAR Release Schedule)
One report won’t determine the entire market’s direction. The more useful signal will be whether several months of data begin pointing toward renewed contract activity and improved affordability.
Bottom Line: What This Story Really Means
America’s housing market is facing a problem that more listings alone cannot fix.
Pending home sales fell 7.3% in September 2026, reaching a record-low index level, even as more homes were available for sale and more sellers reduced asking prices.
The main obstacle is affordability. When mortgage rates rise sharply, the monthly payment can become too high for buyers—even if the listed price has not increased.
But the decline in contracts shouldn’t be confused with a nationwide collapse in home values. Sales activity and home prices are different measures, and a weak market can remain stuck without a sudden price crash.
For potential buyers, the slowdown may create opportunities to negotiate. For sellers, it may require patience and more realistic pricing.
What happens next will depend on whether mortgage rates, incomes, and home prices move back toward a balance that ordinary households can afford.
U.S. Pending Home Sales: Key Questions Explained
Q. What are pending home sales?
Pending home sales measure signed contracts to purchase existing homes before the transactions are completed. The measure helps indicate where completed sales may be heading in the next month or two.
Q. How much did U.S. pending home sales fall in September 2026?
Pending home sales declined 7.3% from August and 11.3% from September 2025, according to the National Association of Realtors.
Q. Was September 2026 really a record low for pending home sales?
Yes. The Pending Home Sales Index fell to 66.0, its lowest recorded level in the series dating back to 2001. That is a record for this index, not a claim that every housing-market measure reached an all-time low.
Q. Does a 7.3% decline mean U.S. home prices fell 7.3%?
No. The 7.3% figure measures the monthly decline in signed purchase contracts. It does not measure the change in property values or completed sale prices.
Q. What was the average 30-year mortgage rate in October 2026?
Freddie Mac reported an average 30-year fixed mortgage rate of 7.40% on October 15, 2026. That weekly rate was higher than the 6.66% average recorded on August 27.
Q. Why can completed home sales increase while pending sales fall?
The figures measure different stages of a transaction. Completed sales may reflect contracts signed weeks earlier, while pending sales measure more recent contracts that have not yet closed.
Q. Are falling asking prices the same as falling home-sale prices?
No. Asking prices are what sellers advertise, while sale prices reflect completed transactions. Both can change differently depending on which homes are listed and which homes actually sell.
Q. Does a weaker housing market help first-time buyers?
It can improve negotiating opportunities, but higher mortgage rates may still make monthly payments unaffordable. The benefit depends on local home prices, available financing, and the buyer’s financial situation.
Q. When will the next major housing sales reports be released?
The National Association of Realtors has scheduled the October 2026 existing-home sales report for November 12 and the October pending home sales report for November 18, 2026.
Did this help make the story clearer? 🙂
WIN keeps unpacking the “why” behind the news—clearly and simply!
Sources
September Pending Home Sales and Record-Low Activity
National Association of Realtors — Pending Home Sales Decreased 7.3% in September
Reuters — U.S. Pending Home Sales Tumble to Record Low in September
Mortgage Rates and Housing Affordability
Freddie Mac — Mortgage Market Survey Archive
Freddie Mac — Mortgage Rates Hold Steady at 7.40%, October 15, 2026
Realtor.com — September 2026 Housing Trends: Rates, Inventory, and Price Reductions
Home Prices, Completed Sales, and Construction
National Association of Realtors — Existing-Home Sales Statistics
U.S. Census Bureau — New Residential Construction, September 2026
Upcoming Housing Market Reports
National Association of Realtors — 2026 Statistical News Release Schedule
Keep Reading
Why do different mortgage websites show different rates?
The national averages in this story are useful benchmarks, but buyers can see very different mortgage numbers across websites. The earlier WIN explanation breaks down which rates are being quoted and why they differ.
Why Are Mortgage Rates Back Above 7%—and Why Does Every Website Show a Different Number?
How can new-home sales rise when mortgage rates are so high?
The slowdown in existing-home contracts tells only part of the housing story. New-home builders can use financing incentives and price reductions to attract buyers, which helps explain why the two markets can sometimes move differently.
Mortgage Rates Are High—So Why Did New-Home Sales Jump 6.4%?