Why Are Homebuilders Cutting Prices While American Homes Remain So Expensive?

You see a newly built house with a price reduction posted outside.
Maybe the builder is even offering help with your mortgage.
That sounds like good news for someone trying to buy a home. But then you look at the monthly payment—and the house still feels out of reach.
So what exactly is going on?
On October 19, 2026, the National Association of Home Builders (NAHB) reported something striking: 43% of surveyed homebuilders had cut prices, yet builder confidence had fallen to its lowest level in more than 14 years.
The problem is that making a house cheaper and making it affordable are not necessarily the same thing.
Builders can lower their asking prices. They can help cover closing costs. Some can even subsidize mortgage rates.
But they cannot make high borrowing costs, construction expenses, or strained household budgets disappear.
And that is why America’s housing market can be struggling even while so many homes still seem expensive.
※ Images in this article are AI-generated illustrations created to help explain the story. They are not actual photographs, and depictions of people, places, or events may differ slightly from reality.
The latest figures reveal a housing market caught between two pressures: buyers who cannot comfortably afford today’s payments and builders who cannot easily reduce their costs.
Understanding that tension helps explain why discounts are spreading without producing a broad recovery in homebuying.
What Does a Homebuilder Confidence Score of 29 Actually Mean?
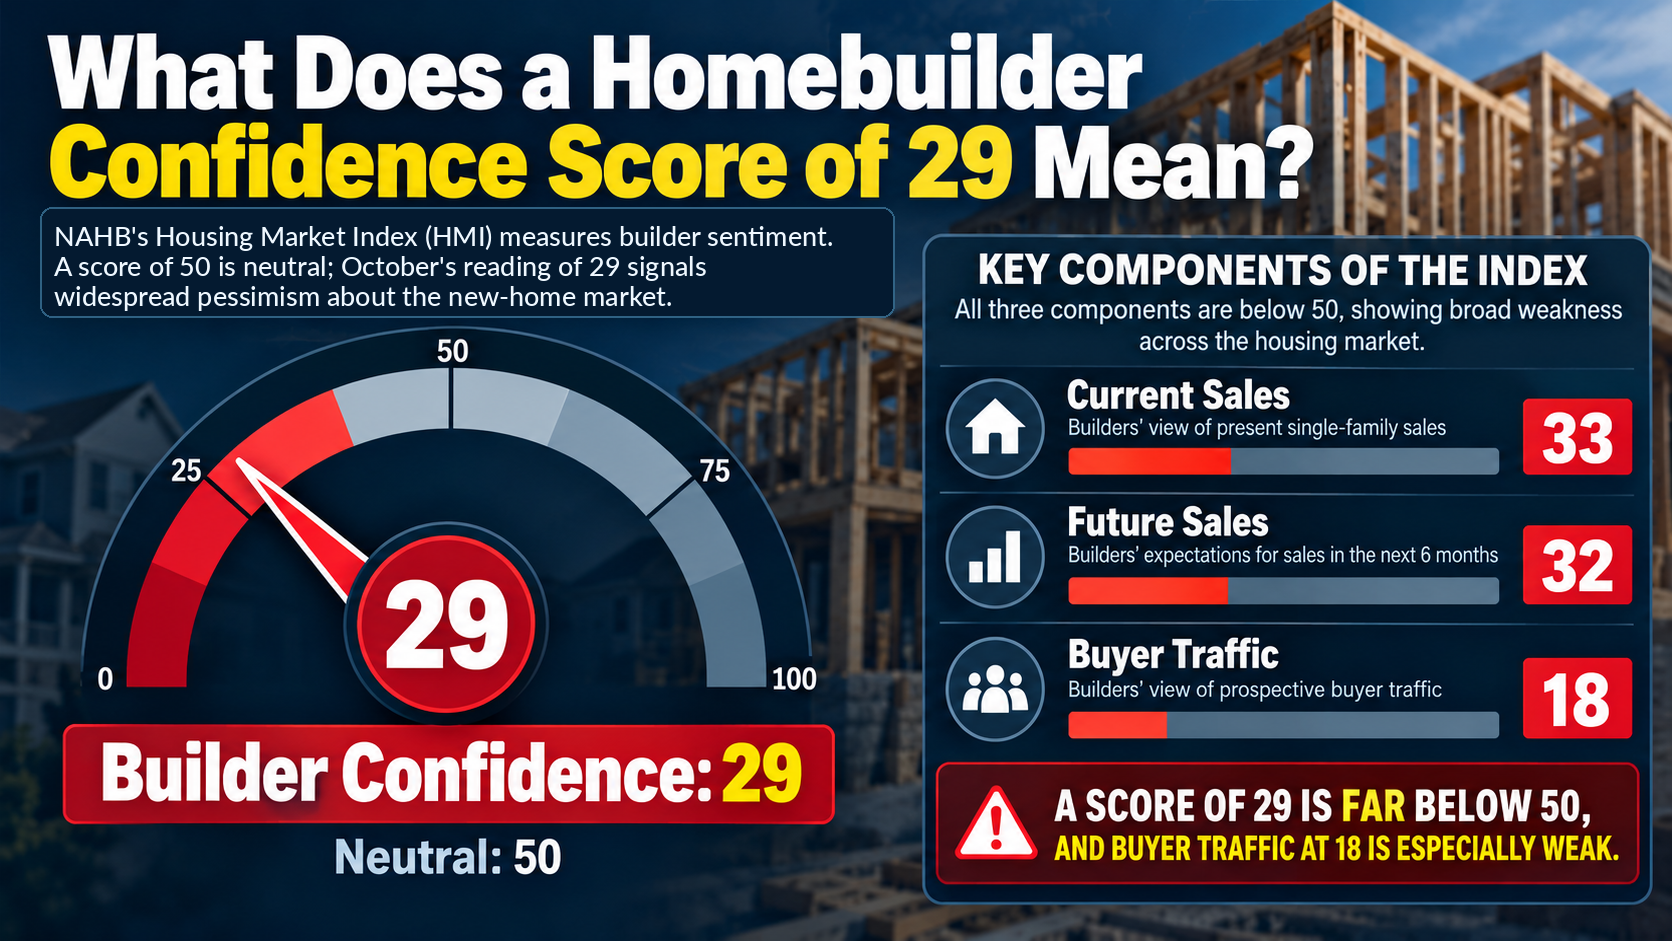
A reading of 29 means builders are deeply pessimistic about the market for newly built single-family homes. It does not mean home prices have fallen 29%, or that only 29% of builders are confident.
The NAHB/Wells Fargo Housing Market Index (HMI) measures builders’ assessments of current sales, expected sales over the next six months, and traffic from prospective buyers.
A reading above 50 generally indicates that more builders see conditions as good than poor. A reading below 50 signals the opposite.
The index fell three points to 29 in October, its lowest level since June 2012. (NAHB)
The components show where the weakness is coming from.
| Housing Market Index measure | September 2026 | October 2026 |
|---|---|---|
| Overall builder confidence | 32 | 29 |
| Current sales conditions | 35 | 33 |
| Sales expectations for the next six months | 37 | 32 |
| Traffic from prospective buyers | 23 | 18 |
The October data show that builders were less optimistic about current sales, future sales, and the number of people showing up to consider buying.
Buyer traffic is particularly revealing.
The traffic index dropped to 18, its lowest level since April 2012 apart from the exceptional collapse at the beginning of the COVID-19 pandemic in April 2020. (NAHB)
That does not mean nobody wants a house.
It means far fewer prospective buyers are actively visiting and seriously considering new homes than builders would like.
Some households may still need more space or want to move. But wanting to buy and being financially able to buy are different things.
For builders, that distinction is becoming increasingly expensive.
Why Are 43% of Homebuilders Cutting Prices?
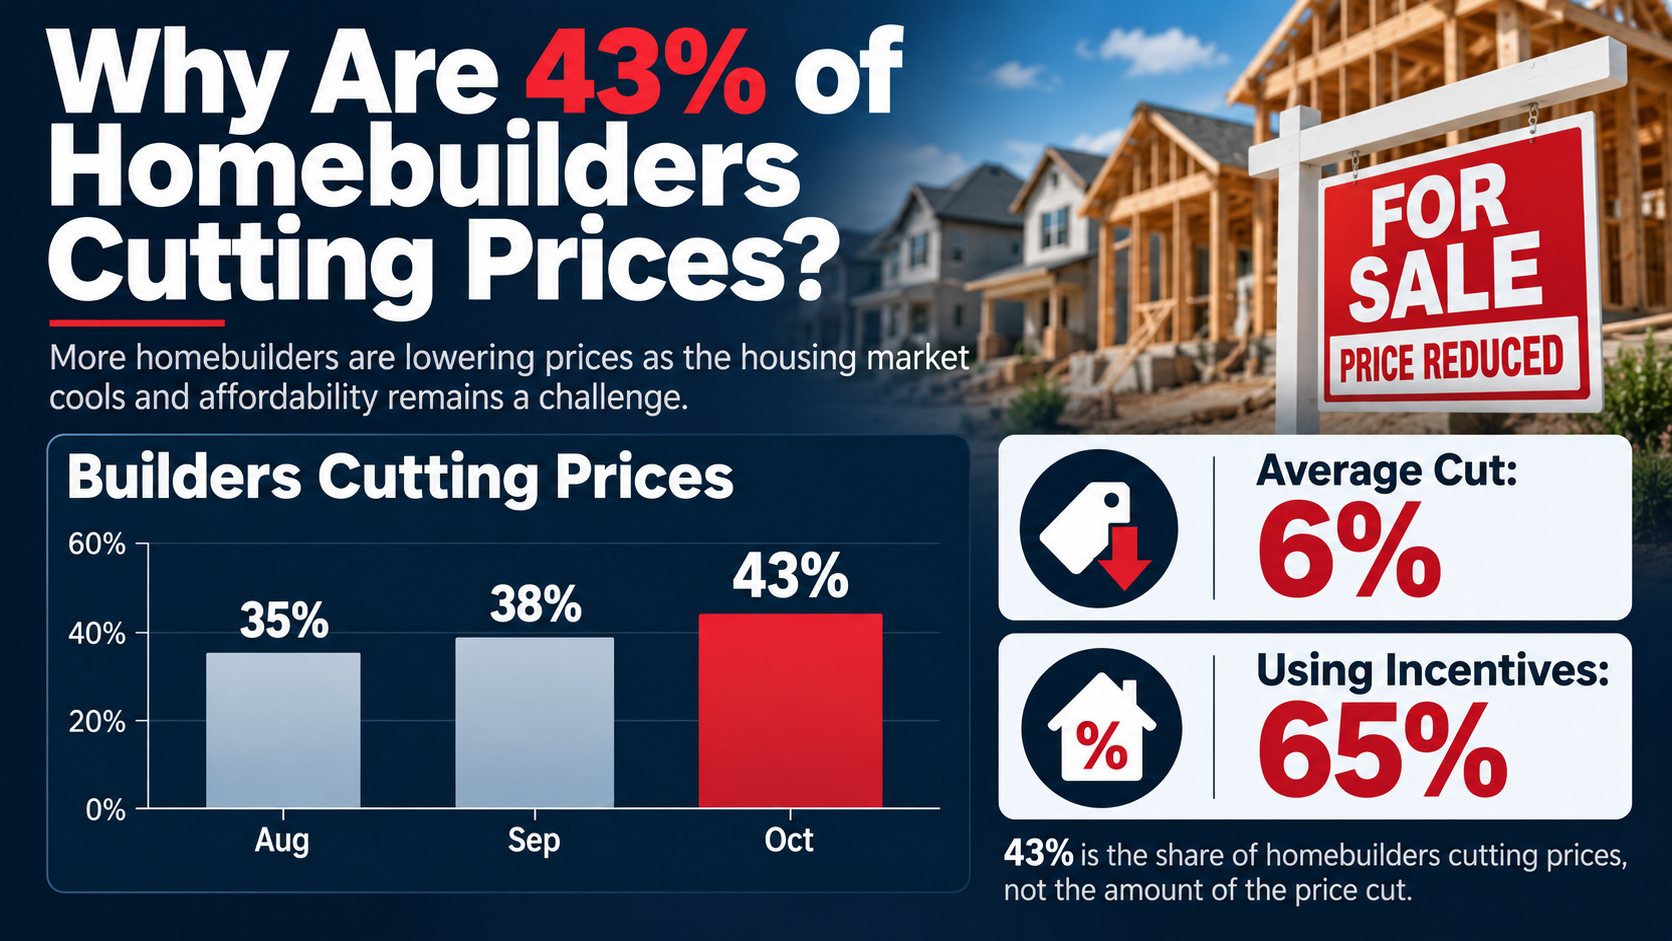
Builders are cutting prices because finding enough qualified buyers has become harder. A completed house that sits unsold continues to tie up money, while carrying costs and financing expenses can keep accumulating.
The October NAHB survey found that 43% of builders were cutting prices, up from 38% in September and 35% in August.
That was the highest share of builders reporting price cuts during the 2020–2026 period tracked in the survey.
The average price reduction remained at 6% for the seventh consecutive month. Meanwhile, 65% of builders reported using sales incentives. (NAHB)
Three different statistics are being discussed here.
| October 2026 figure | What it actually means |
|---|---|
| 43% cut prices | Share of surveyed builders reducing prices |
| 6% average reduction | Average reported price cut among builders reducing prices |
| 65% used incentives | Share of surveyed builders offering sales incentives |
The 43% and 65% groups can overlap. Some builders may both reduce their prices and offer additional benefits.
Those figures should not be added together.
A Price Cut Isn’t the Only Way to Offer a Deal
A builder can try to attract buyers without reducing the advertised purchase price.
For example, a builder might offer to pay part of the buyer’s closing costs or contribute money toward a lower mortgage interest rate.
That second approach is often called a mortgage-rate buydown.
A buydown can work in different ways. Some arrangements reduce the interest rate for the life of the loan; others temporarily lower the buyer’s payment before it increases.
These incentives matter because many prospective buyers are less concerned with the headline price than with how much money must leave their bank account every month.
Builders may prefer to use incentives when possible because reducing a home’s official sale price can also affect pricing expectations for other houses in the same development.
But incentives still cost money.
And when the broader market is weak enough, some builders use both discounts and financing assistance.
Why Can a 6% Discount Still Leave a Home Unaffordable?
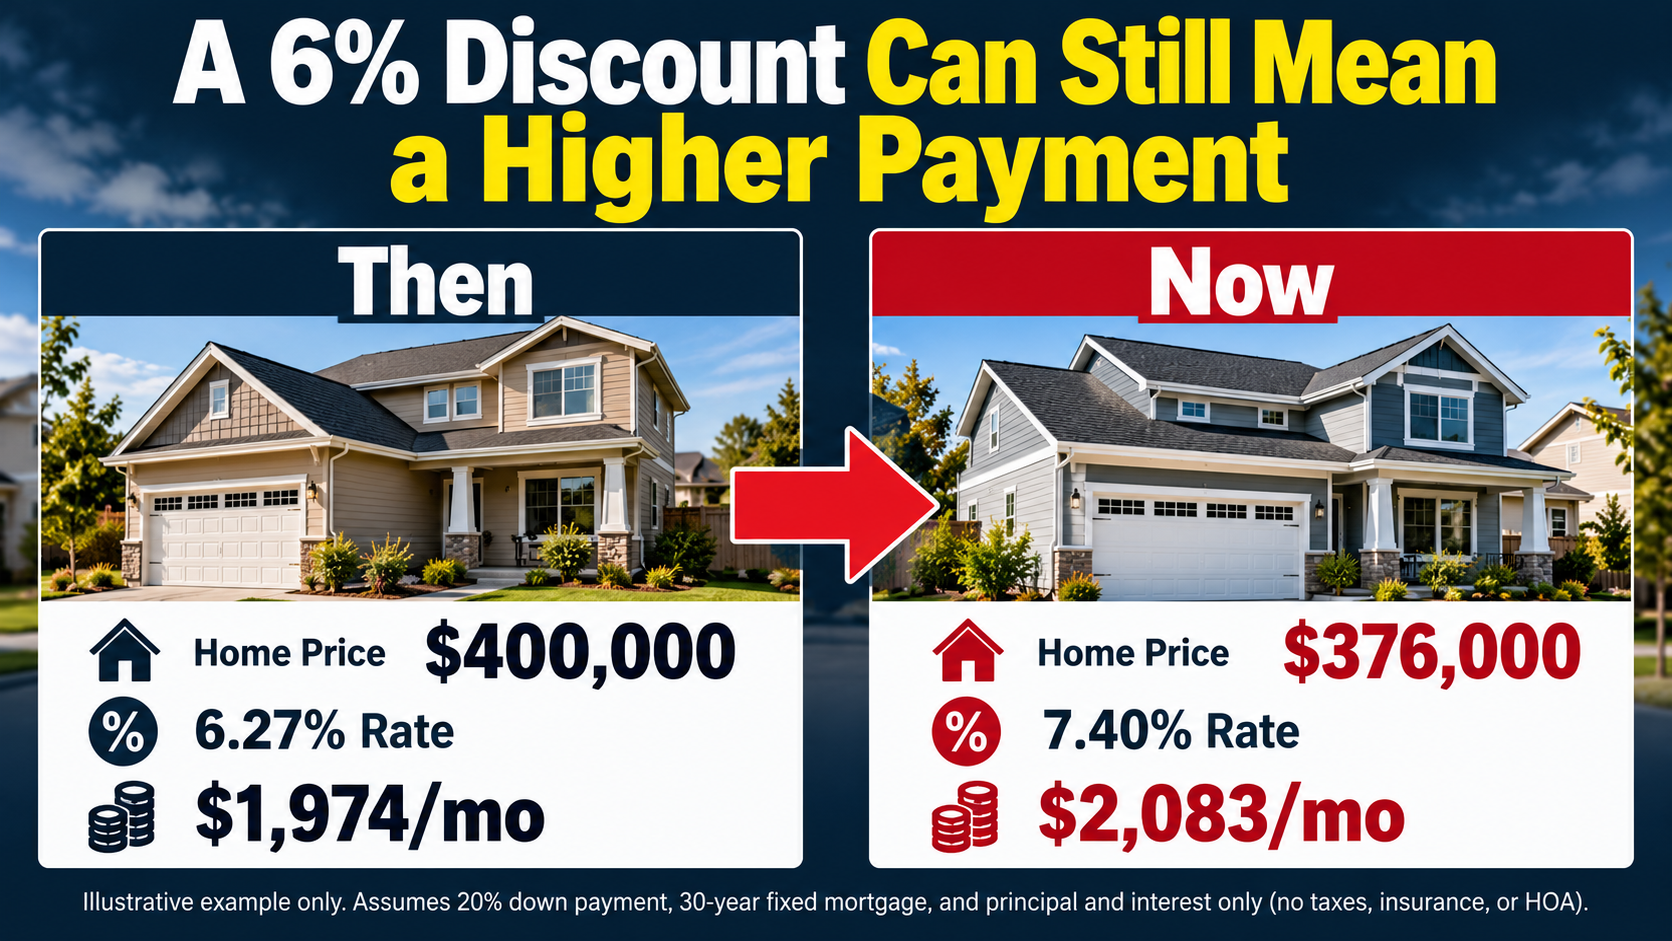
Because a homebuyer is purchasing two things at once: the house itself and, in most cases, the financing needed to pay for it.
A lower sale price helps with the first.
A higher mortgage rate makes the second more expensive.
On October 15, Freddie Mac reported that the average 30-year fixed mortgage rate was 7.40%, compared with 6.27% one year earlier. (Freddie Mac)
That difference can dramatically change the monthly payment.
What the Numbers Look Like on a $400,000 House
Consider a simplified example.
Suppose a house was priced at $400,000. The builder now offers a 6% discount, reducing the price to $376,000.
Assume the buyer makes a 20% down payment and takes a 30-year fixed-rate mortgage.
| Example | Earlier financing | Discounted home today |
|---|---|---|
| Home price | $400,000 | $376,000 |
| Down payment | $80,000 | $75,200 |
| Mortgage amount | $320,000 | $300,800 |
| Mortgage rate | 6.27% | 7.40% |
| Monthly principal and interest | About $1,974 | About $2,083 |
Illustrative calculations using Freddie Mac’s October 2025 and October 2026 rate benchmarks. Payments exclude property taxes, insurance, HOA fees, and other costs. This is not a comparison of actual transactions or a forecast.
The builder has reduced the price by $24,000.
The buyer needs a smaller down payment and borrows less money.
Yet the estimated monthly principal-and-interest payment is still roughly $109 higher than it would have been for the full-price home at the earlier, lower mortgage rate.
There is another way to see the effect.
At today’s 7.40% rate, borrowing $320,000 would cost about $2,216 per month. Reducing the purchase price by 6% and the loan proportionally lowers that payment to about $2,083—a savings of roughly $133 per month.
The discount helps, but it does not erase the larger mortgage-rate increase.
And for a household already near the maximum payment it can afford, the remaining difference can determine whether the purchase is possible.
That is why housing affordability cannot be measured by sale prices alone.
Are Home Prices Actually Falling Across America?
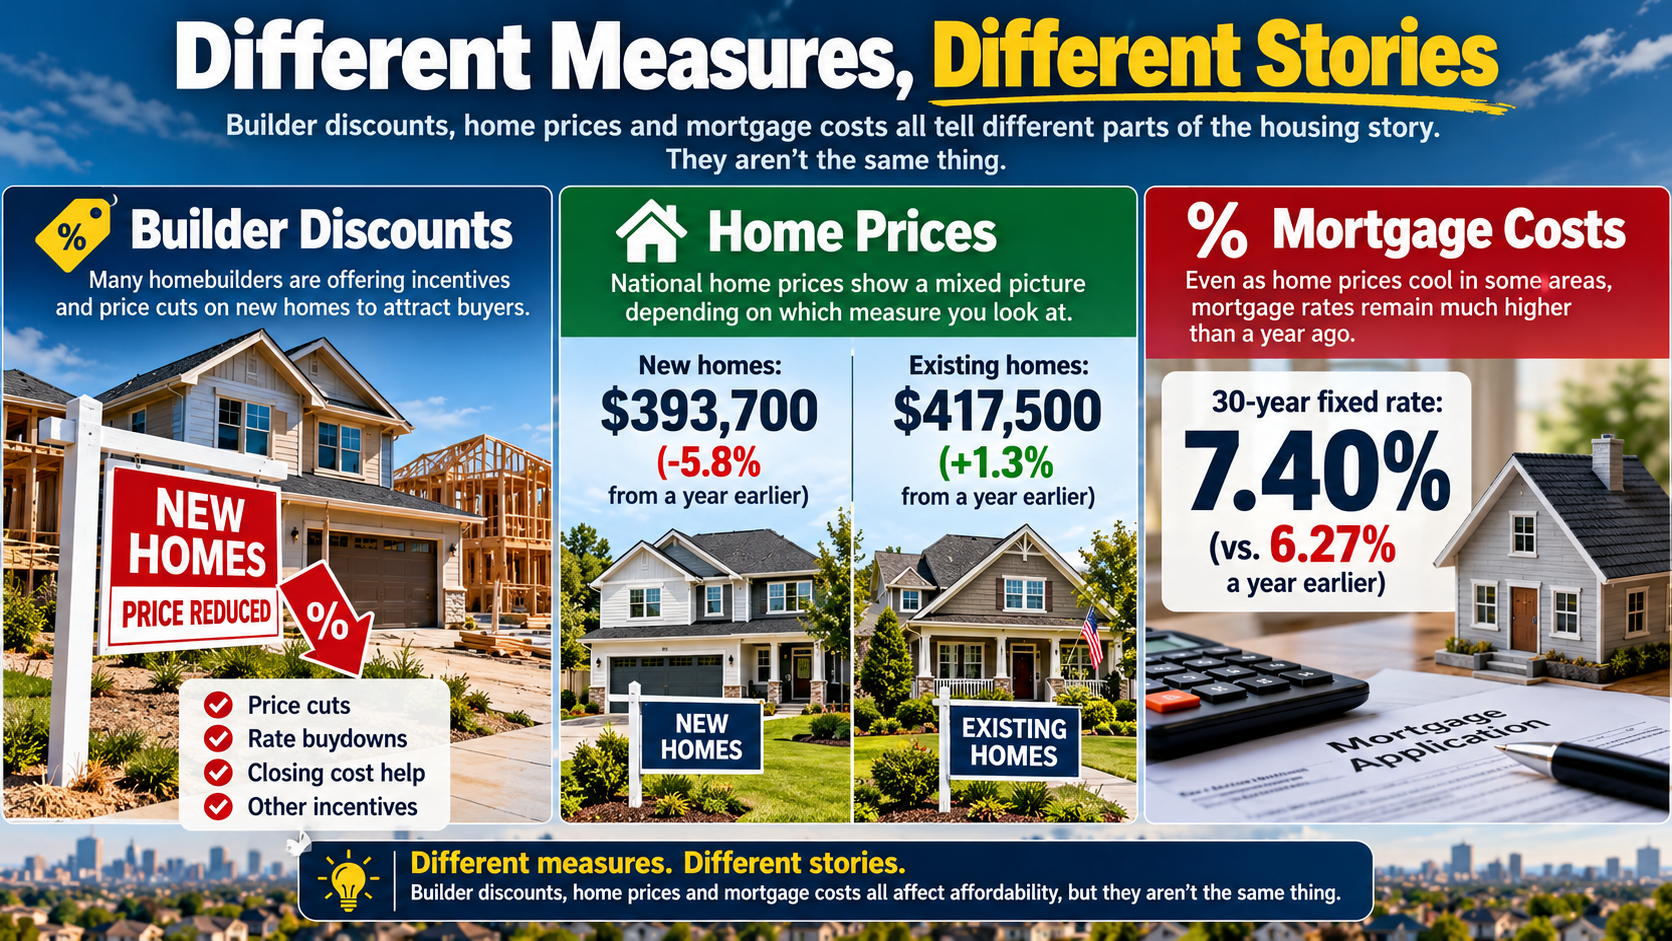
Not necessarily. More builders cutting prices does not mean every home in the United States is becoming cheaper.
The first distinction is between newly built homes and existing homes.
Builders can adjust the prices of houses they are constructing or trying to sell. Existing-home owners make their own decisions based on local conditions, personal finances, and whether they need to move.
The second distinction is between an individual seller’s price reduction and the national median sale price.
A median is the middle price among homes sold during a particular period. It can change because different types of homes are selling—not solely because the same homes have become cheaper.
The recent national data illustrate how complicated the picture can be.
The Census Bureau reported that the median price of a newly sold single-family home was $393,700 in August 2026, down 5.8% from a year earlier. (NAHB)
Meanwhile, the National Association of Realtors reported that the median existing-home sales price reached $417,500 in September 2026, 1.3% higher than a year earlier. (NAR)
Those are different months and different sets of properties, so they cannot establish that an otherwise identical new home is cheaper than an existing one.
But the contrast does show something important.
The new-home market and the resale market can respond differently to the same affordability pressures.
Builders may cut prices aggressively because they need to sell inventory. Existing homeowners may be more willing to wait, particularly if they already have a mortgage with a lower interest rate than they could get today.
And conditions vary enormously by location.
A large development with many available new homes may give buyers substantially more negotiating power than a neighborhood where very few comparable houses are for sale.
A national headline cannot tell you which situation applies to a specific property.
Why Can’t Builders Simply Cut Prices Even More?

Because the sale price is only one side of a builder’s financial calculation.
The other side is how much it costs to acquire the land, finance construction, hire workers, purchase materials, and complete the home.
If those expenses remain high, a builder cannot necessarily keep cutting prices without damaging profitability.
The October NAHB release pointed to several pressures beyond weak demand: higher construction-loan costs, more expensive building materials and diesel, and worsening labor and lot conditions.
NAHB Chairman Bill Owens also said that more than one-third of surveyed builders reported immigration enforcement activity in their market areas during the previous month. He said such activity was contributing to construction delays and discouraging some legally authorized workers from reporting to work. That is the association’s account of the reported effects, not a separately established measure of nationwide construction delays. (NAHB)
These pressures can pull in opposite directions.
| Pressure | What it does to builders |
|---|---|
| Weak buyer demand | Encourages discounts and incentives |
| High construction borrowing costs | Raises the cost of financing projects |
| Expensive materials and transportation | Makes construction harder to complete cheaply |
| Labor shortages or delays | Can increase scheduling and carrying costs |
| Unsold completed homes | Ties up capital until buyers are found |
There is also a timing problem.
A builder may have purchased land, arranged financing, and ordered materials months before selling the finished house.
Those earlier costs do not automatically fall simply because current buyers are unwilling to pay the original asking price.
As a result, builders can face an uncomfortable choice: reduce their profit margins to make sales, keep waiting for buyers, or scale back future construction plans.
None of those options necessarily solves the affordability problem.
Does the 14-Year Low Mean a Housing Crash Is Coming?
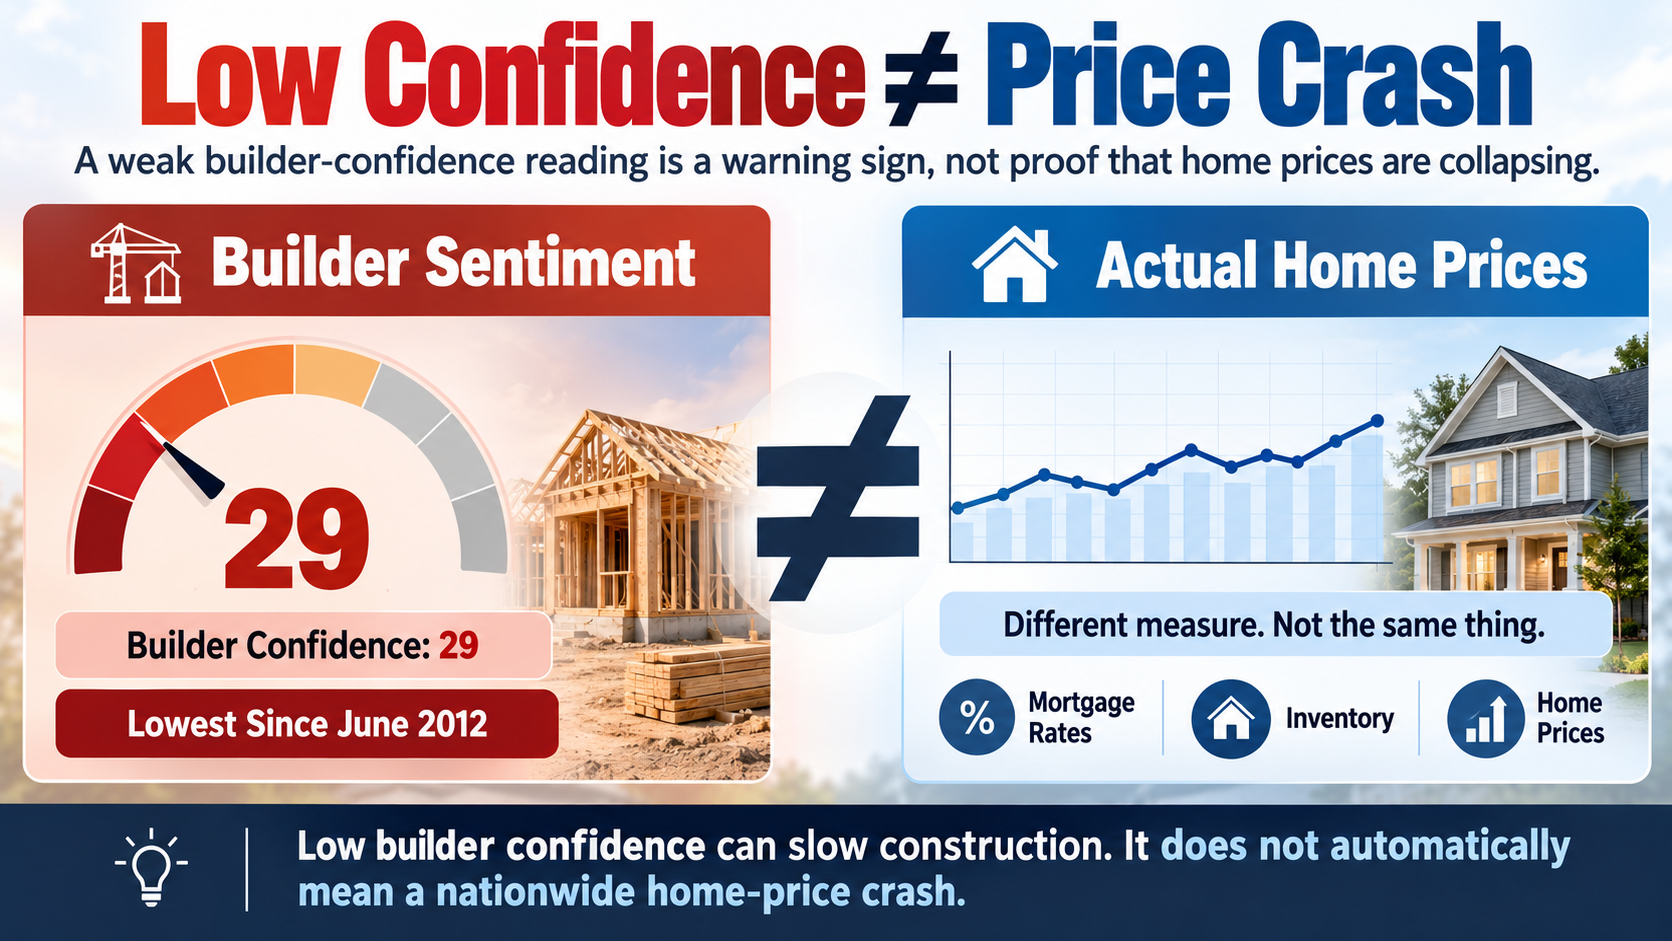
No. A historically low builder-confidence reading is a serious warning about industry conditions, but it is not proof that a nationwide housing crash is underway or inevitable.
The HMI measures what builders think about selling newly constructed single-family homes.
It does not directly measure mortgage defaults, foreclosures, bank losses, or national home-price declines.
Those are different questions.
An especially important distinction is what happens to construction when demand weakens.
A builder with unsold inventory may postpone future projects rather than continue building at the same pace.
In August, the Census Bureau estimated that 483,000 new single-family homes were available for sale, equivalent to 8.5 months of supply at the prevailing sales pace. (NAHB)
That is substantial inventory for the new-home market.
But it does not mean all those homes were finished and available for immediate occupancy. The inventory includes homes at different stages of construction.
A prolonged slowdown can create another problem.
If builders sharply reduce new projects, fewer homes may be completed later. Depending on local conditions, that can limit future supply even if buyers are struggling today.
This is one of the more frustrating features of housing affordability.
Weak demand can discourage construction. Reduced construction can then make it harder to expand supply when demand eventually improves.
Still, that is a potential market mechanism—not a prediction that every region will experience a future shortage.
The October data support a clear conclusion: builders are facing an unusually difficult environment.
They do not establish what national home prices will do next.
Where Is the Housing Market Weakest?
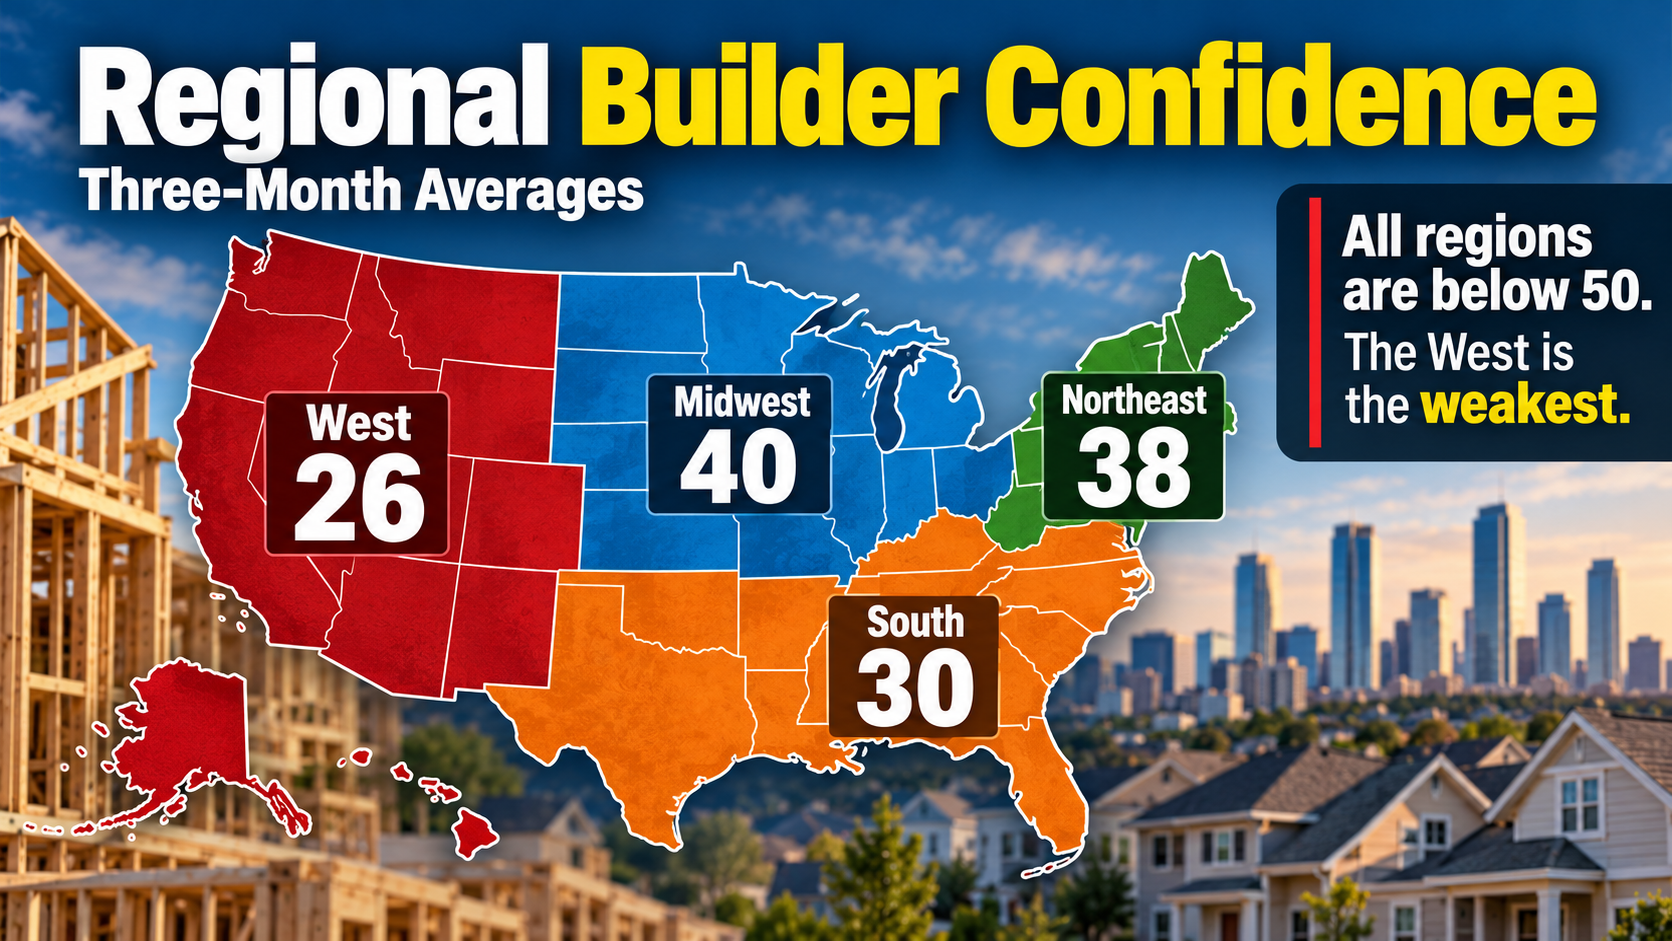
The October NAHB survey suggests that builders are pessimistic across every major U.S. region, although the degree of pessimism varies.
NAHB’s three-month moving averages show the following regional readings:
| Region | October 2026 HMI | Monthly change |
|---|---|---|
| Northeast | 38 | -1 |
| Midwest | 40 | -3 |
| South | 30 | -1 |
| West | 26 | -2 |
These are three-month regional averages, not the same measurement period as the single-month national index of 29. (NAHB)
The Midwest posted the highest regional reading, while the West was the weakest.
But even the Midwest remained below the neutral level of 50.
That matters because the national housing market is not one market.
A buyer shopping for a newly built home in an area with abundant inventory may encounter several competing builders, multiple discounted properties, and different financing offers.
Someone searching in a neighborhood with little available construction could face an entirely different set of choices.
Regional sentiment offers a useful starting point. It does not replace information about individual communities, available homes, or local prices.
What Should Homebuyers Actually Do With This Information?
The most useful lesson is that the advertised home price is only one part of the deal.
A builder offering a $20,000 price reduction may not necessarily provide a better overall financial package than another builder offering a smaller discount and more favorable permanent financing.
And a mortgage advertised with an unusually low initial rate may be less attractive if that rate increases after the promotional period.
The Consumer Financial Protection Bureau recommends comparing formal Loan Estimates, including the interest rate, monthly payment, upfront costs, lender credits, and the amount of cash required at closing. (CFPB)
For anyone considering new construction, these questions are especially useful:
What is the final purchase price? Ask whether the advertised discount is already reflected in the listing price and whether it applies to the particular house.
Is the mortgage-rate incentive permanent or temporary? If the initial payment is subsidized for only a few years, find out what happens when the subsidy expires.
What is the total monthly housing cost? Include principal, interest, property taxes, homeowners insurance, mortgage insurance if applicable, and HOA dues.
Are there conditions attached to the builder’s offer? Some incentives may be available only through a preferred lender, on certain homes, or with specific closing deadlines.
How does the offer compare with other lenders? Ask for comparable Loan Estimates before assuming that a builder-affiliated financing package is the lowest-cost option.
The CFPB’s Loan Estimate Explainer can help buyers understand how those costs appear on mortgage paperwork.
A discounted home can be a good opportunity for a buyer whose income, savings, and long-term budget support the purchase.
But a deal is not automatically affordable because the original price has been reduced.
If the payment is still financially uncomfortable, the discount has not solved that buyer’s problem.
What Would Signal That the Housing Market Is Finally Improving?
A genuine improvement would require more than one month of better builder sentiment—or another increase in discounts.
Several developments would be worth watching together.
Mortgage Rates Become More Manageable
Lower mortgage rates, if they occur without an offsetting surge in prices, could allow more households to qualify for a loan or reduce monthly payments.
Mortgage rates are influenced by longer-term financial markets as well as broader expectations about inflation and monetary policy. They do not automatically move point for point with the Federal Reserve’s short-term benchmark rate.
Buyer Traffic Begins to Recover
The October buyer-traffic reading of 18 is an especially weak part of the NAHB report.
An improvement in buyer visits, followed by actual purchases, would be more encouraging than a rise in sentiment based only on hopes for future conditions.
Builders Can Sell Homes Without Increasing Discounts
If sales strengthen while fewer builders need to cut prices or offer large incentives, that would suggest demand is improving on more sustainable terms.
But a reduction in discounts alone would not prove recovery. Builders could also withdraw homes from the market or reduce new construction.
New Construction and Inventory Stabilize
The number of homes being built, the number available for sale, and the time needed to sell them all matter.
Rising sales supported by an adequate flow of new construction would be more encouraging for long-term affordability than a recovery caused mainly by a shortage of available homes.
No single indicator can answer all these questions.
The October 19 report is a warning about the market today. The next several months will show whether the pressure is easing—or becoming more entrenched.
Bottom Line: What This Story Really Means
American homebuilders are cutting prices because buyers are pulling back. But lower asking prices have not been enough to overcome higher mortgage rates, expensive construction, and the broader pressure on household budgets.
The October 2026 numbers make that disconnect difficult to ignore.
Builder confidence fell to 29, the lowest since June 2012. The share of builders reducing prices reached 43%, while 65% were offering sales incentives.
Those figures are not evidence that every American home is suddenly becoming affordable. They show how hard builders are working to find buyers.
The housing market’s biggest problem is not simply what homes cost. It is the gap between what homes cost to build and finance and what households can comfortably pay.
Until that gap narrows, discounts can keep spreading without producing the kind of housing recovery that buyers and builders both want.
U.S. Homebuilder Price Cuts: Key Questions Explained
Q. How low did U.S. homebuilder confidence fall in October 2026?
The NAHB/Wells Fargo Housing Market Index fell to 29, its lowest reading since June 2012. The index measures builders’ assessments of current sales, future sales, and prospective buyer traffic.
Q. What percentage of homebuilders are cutting prices?
In the October 2026 NAHB survey, 43% of builders reported cutting prices, up from 38% in September and 35% in August. That is the share of participating builders reporting price cuts, not the percentage by which all home prices fell.
Q. How much are builders reducing new-home prices?
The average reported price reduction was 6% in October, the seventh consecutive month at that level. Individual discounts vary by builder, property, and market.
Q. Why are home prices still so expensive when builders are offering discounts?
High mortgage rates can offset much of the monthly-payment benefit of a lower purchase price. Builders also face land, labor, material, transportation, and financing costs that limit how far they can reduce prices.
Q. What was the average 30-year mortgage rate in October 2026?
Freddie Mac reported an average 30-year fixed mortgage rate of 7.40% as of October 15, 2026, compared with 6.27% one year earlier. Individual borrowers may receive different rates depending on their qualifications and loan terms.
Q. What is the difference between a home price cut and a mortgage-rate buydown?
A price cut reduces the amount paid for the house. A mortgage-rate buydown uses an upfront subsidy to lower borrowing costs, either temporarily or for the loan’s full term, depending on the arrangement.
Q. Does the low builder-confidence index mean home prices are about to crash?
No. Builder confidence measures sentiment about the new-home market, not nationwide home-price changes or foreclosure conditions. A low reading signals industry weakness but does not establish that a housing crash will occur.
Q. Are new homes cheaper than existing homes?
Not necessarily. National median prices reflect different homes sold in different locations and sometimes different periods. Buyers need to compare similar properties in the same market, including financing costs and incentives.
Q. Can a homebuilder require buyers to use a preferred lender to receive an incentive?
An incentive may have conditions tied to a particular financing arrangement, so buyers should review the actual offer terms and applicable rules. Comparing Loan Estimates from other lenders can help determine whether the total package is competitive.
Q. What should buyers watch before deciding whether to purchase a home?
Mortgage rates, local inventory, comparable home prices, builder discounts, and the full cost of financing are more useful together than any single national statistic. Buyers should focus on a payment and overall cost they can realistically afford.
Did this help make the story clearer? 🙂
WIN keeps unpacking the “why” behind the news—clearly and simply!
Sources
October 2026 Builder Confidence and Price Cuts
National Association of Home Builders — Builder Sentiment Falls on Rising Rates, October 19, 2026
Reuters — U.S. Homebuilder Sentiment Tumbles to Nearly 14½-Year Low in October
NAHB — Builder Sentiment Falls on Higher Interest Rates and Costs, September 2026
Mortgage Rates and Housing Market Prices
Freddie Mac — Mortgage Rates Hold Steady at 7.40%, October 15, 2026
NAHB — New Home Sales Rise as Affordability Challenges Continue, September 24, 2026
National Association of Realtors — Existing-Home Sales Statistics
Mortgage Offers and Buyer Protections
Consumer Financial Protection Bureau — Compare and Negotiate Your Loan Offers
Consumer Financial Protection Bureau — Loan Estimate Explainer
Keep Reading
Why Did New-Home Sales Rise Before Builder Confidence Fell Further?
August sales initially suggested that builders were finding ways to attract buyers despite high financing costs. The earlier report explains how contract timing, incentives, and uncertain monthly sales estimates can make a short-term rebound look stronger than the underlying market.
Mortgage Rates Are High—So Why Did New-Home Sales Jump 6.4%?
Why Do Mortgage Rate Websites Show Different Numbers?
Freddie Mac’s weekly average is a useful benchmark, but it is not necessarily the interest rate an individual borrower will receive. Differences among mortgage-rate websites reflect how rates are measured, when they are updated, and which borrowers and loan products are included.
Why Are Mortgage Rates Back Above 7%—and Why Does Every Website Show a Different Number?