If the U.S. Economy Is Growing 3.4%, Why Are Americans Still Struggling With Inflation?

The economy is growing. Businesses are investing. Americans are still spending.
So why does paying for groceries, gasoline, housing, and other everyday expenses continue to feel so difficult?
That question became harder to ignore on October 29, 2026, when two major economic reports painted very different pictures of American life.
One showed that the U.S. economy had expanded at a strong 3.4% annualized rate during the third quarter.
The other showed that the Federal Reserve’s preferred inflation measure had climbed 3.6% over the previous 12 months as of September.
Both numbers can be correct. And neither tells the entire story of how much money an American household actually has left after paying its bills. (Bureau of Economic Analysis · Bureau of Economic Analysis: Personal Income and Outlays)
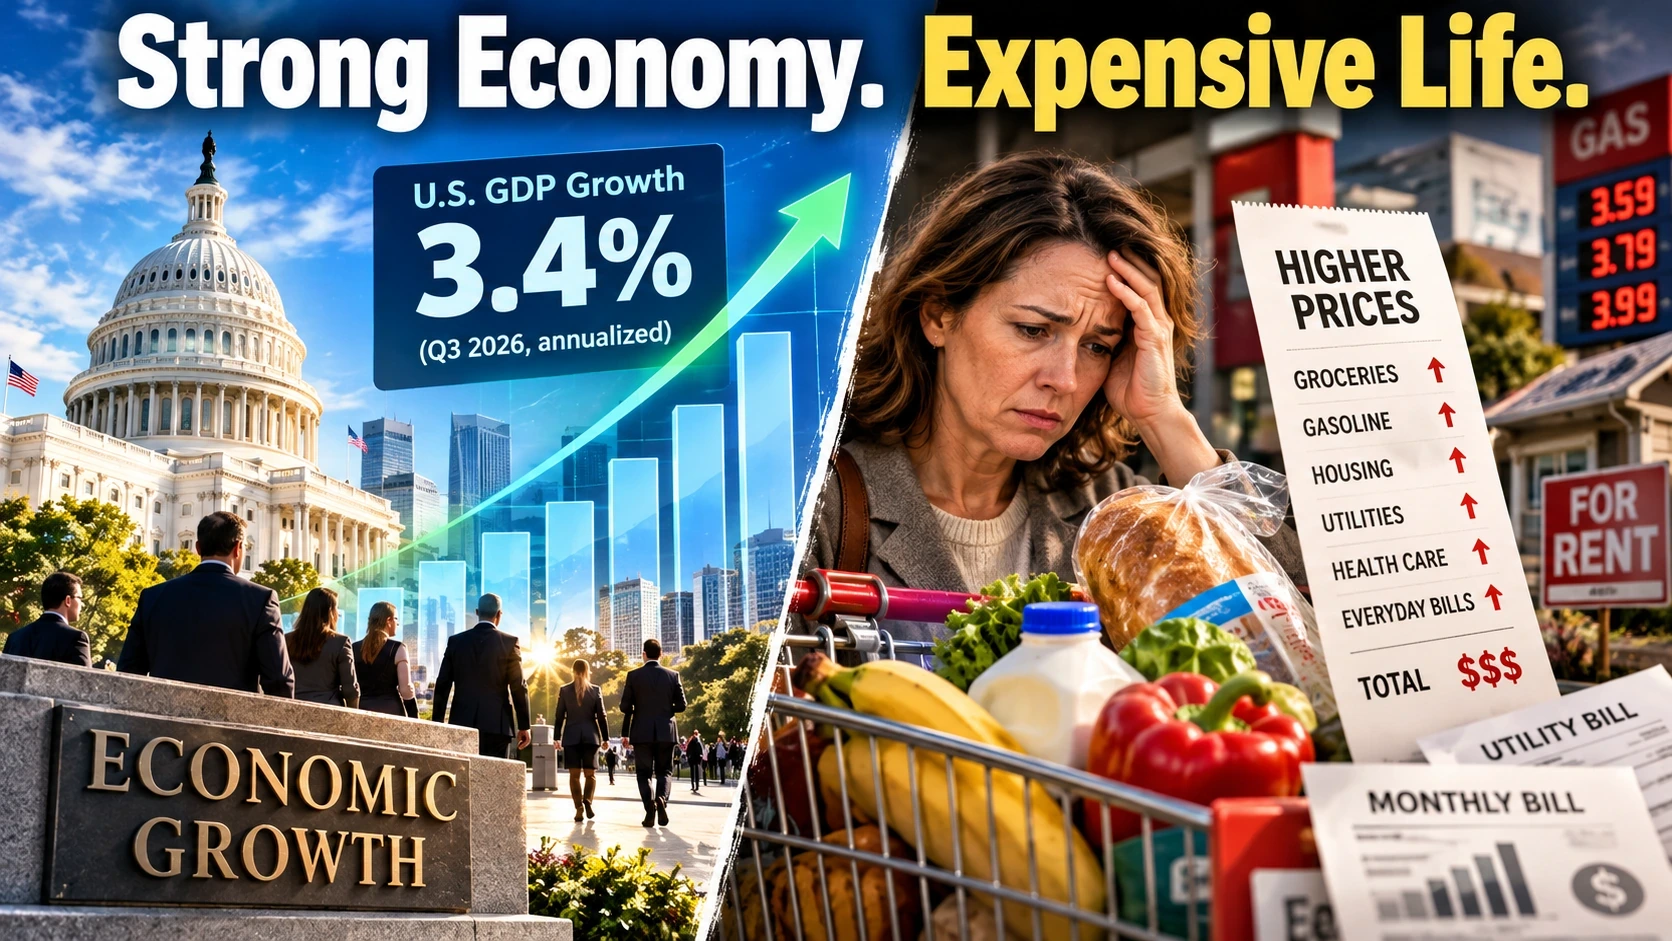
※ Images in this article are AI-generated illustrations created to help explain the story. They are not actual photographs, and depictions of people, places, or events may differ slightly from reality.
The apparent contradiction starts to make sense when we separate three things that often get mixed together: economic output, consumer prices, and purchasing power.
A country can produce more goods and services while its residents still find everyday life increasingly expensive.
What Does 3.4% GDP Growth Actually Mean?
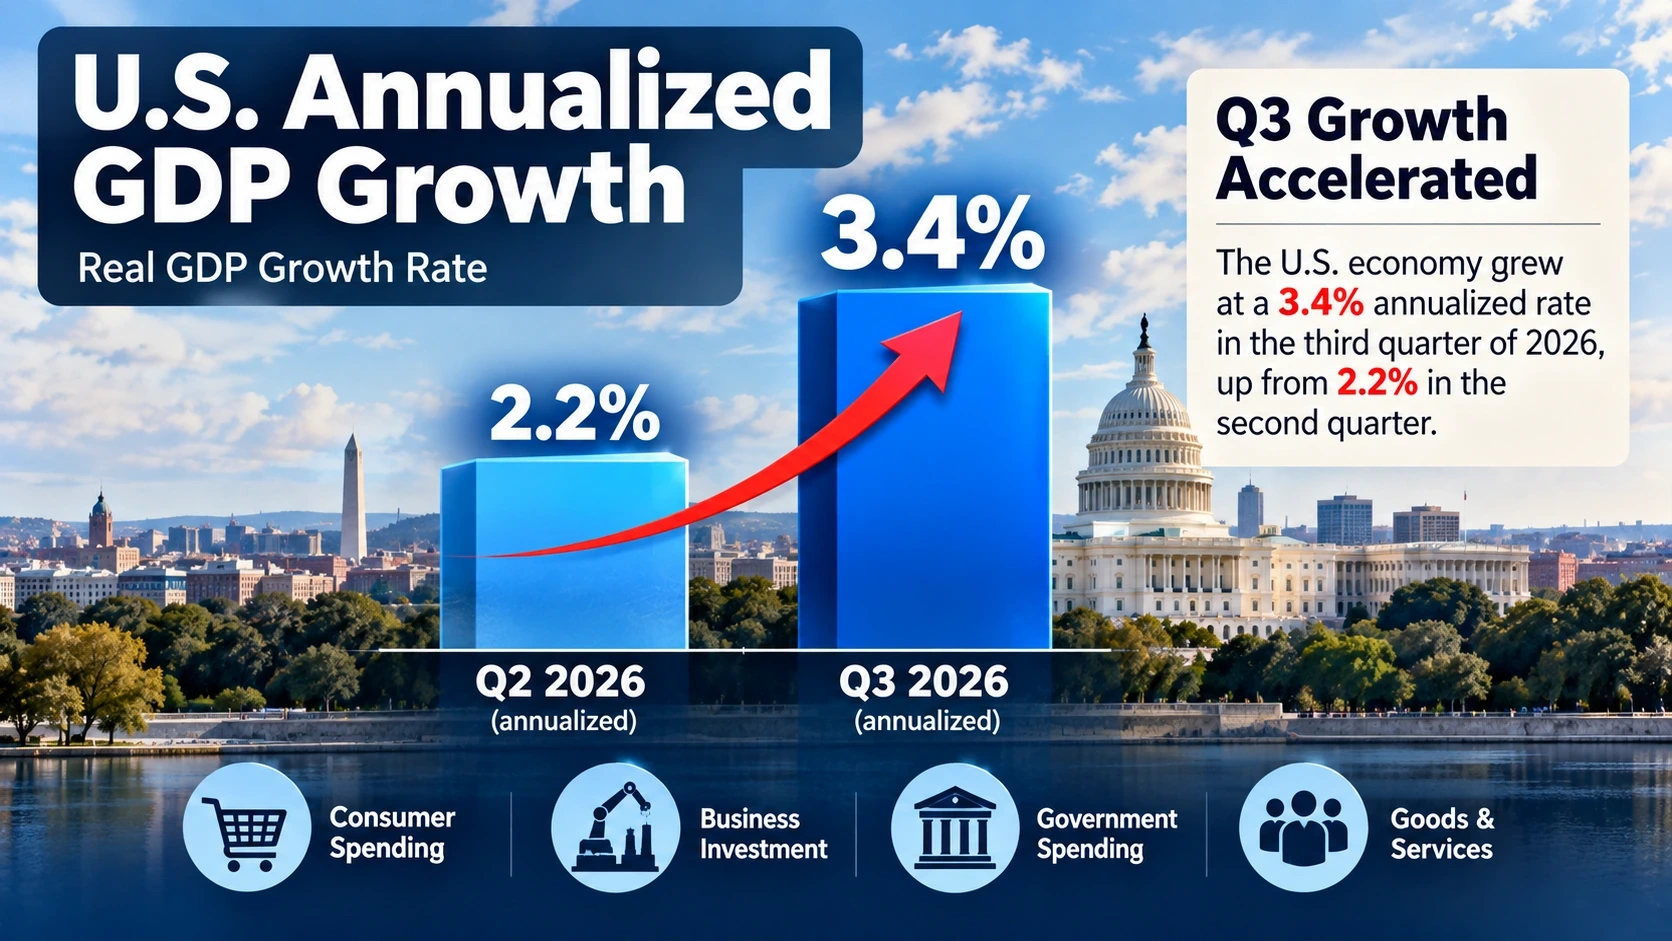
The 3.4% figure measures how quickly the entire U.S. economy expanded, not how much richer individual Americans became.
Gross domestic product, or GDP, measures the value of goods and services produced within the country.
According to the Bureau of Economic Analysis, real GDP grew at an annualized rate of 3.4% from July through September 2026, compared with 2.2% in the second quarter. The third-quarter increase itself was approximately 0.8%; the larger headline figure expresses that quarterly pace as though it continued for a full year. (Bureau of Economic Analysis)
That distinction matters.
GDP can rise because businesses purchase more equipment, companies increase production, governments spend more, or consumers buy additional goods and services.
It does not mean every worker receives a corresponding raise.
Nor does it guarantee that the benefits of growth reach every household equally.
Imagine a town where several large companies expand their operations and generate millions of dollars in additional business activity.
The town’s economy might be growing rapidly. But a resident whose paycheck has barely changed could still struggle to pay rent and buy groceries.
National GDP measures the larger economy. A household budget measures something much more personal.
Why Are Prices Still Rising When the Economy Is Growing?
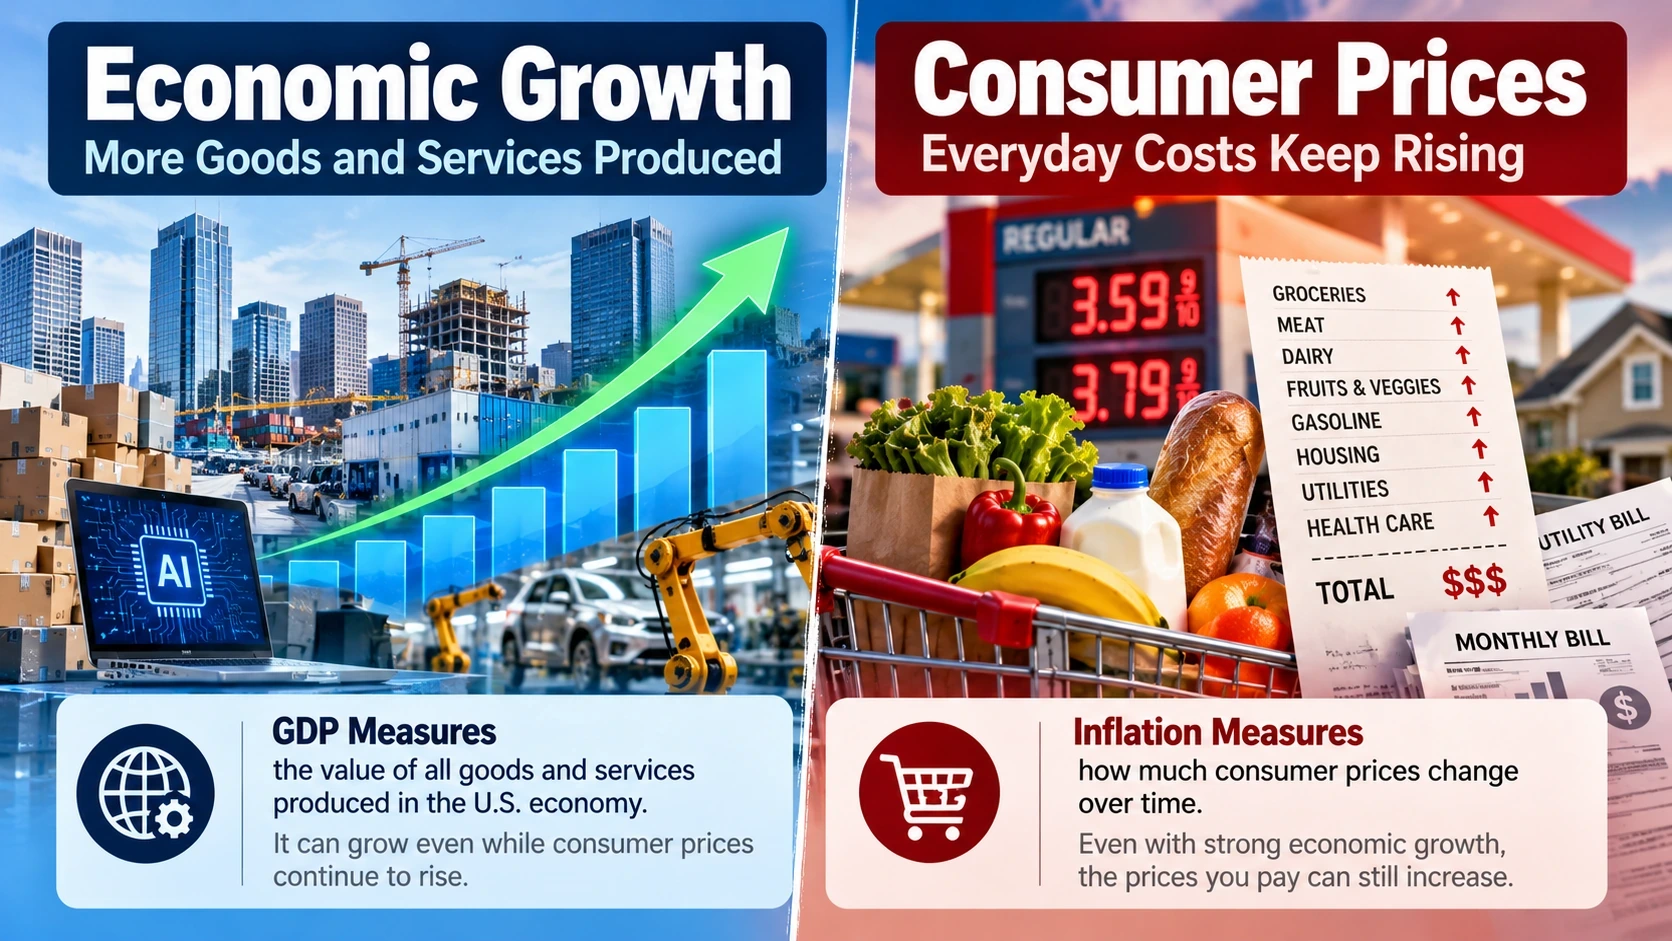
Because economic growth and inflation measure different things.
GDP measures production. Inflation measures how much prices are changing.
The September 2026 Personal Consumption Expenditures (PCE) price index rose 0.5% from August and 3.6% compared with September 2025. The annual rate was up from 3.4% in August. (Bureau of Economic Analysis)
The PCE index tracks prices across a broad range of consumer goods and services. It is particularly important because the Federal Reserve uses it to evaluate progress toward its 2% inflation goal.
Inflation Is Not the Same as the Price Level
Suppose an illustrative basket of purchases cost $100 a year ago.
If its price increased at the same 3.6% rate as the overall PCE index, that basket would now cost $103.60.
That example does not mean everyone’s groceries increased by exactly 3.6%. Different products and households experience different price changes.
But it demonstrates an important point: even if inflation eventually slows to 2%, prices would generally still be rising—just more slowly.
Lower inflation does not automatically mean lower prices.
That helps explain why families can remain frustrated even after hearing that inflation has improved from an earlier peak.
Why Do Some Reports Show 2.1% Inflation Instead of 3.6%?
The October 29 GDP release also reported a 2.1% annualized increase in the PCE price index during the third quarter.
That is not a contradiction.
The 2.1% figure measures the pace of price changes between the second and third quarters, expressed at an annual rate. The 3.6% figure measures how much the index increased from September 2025 to September 2026.
They use different comparison periods. (Bureau of Economic Analysis: GDP Report · Bureau of Economic Analysis: September PCE)
The same principle applies to GDP and inflation: percentages are meaningful only when readers understand exactly what is being measured and over what period.
What Did the Latest Report Reveal About Americans’ Purchasing Power?
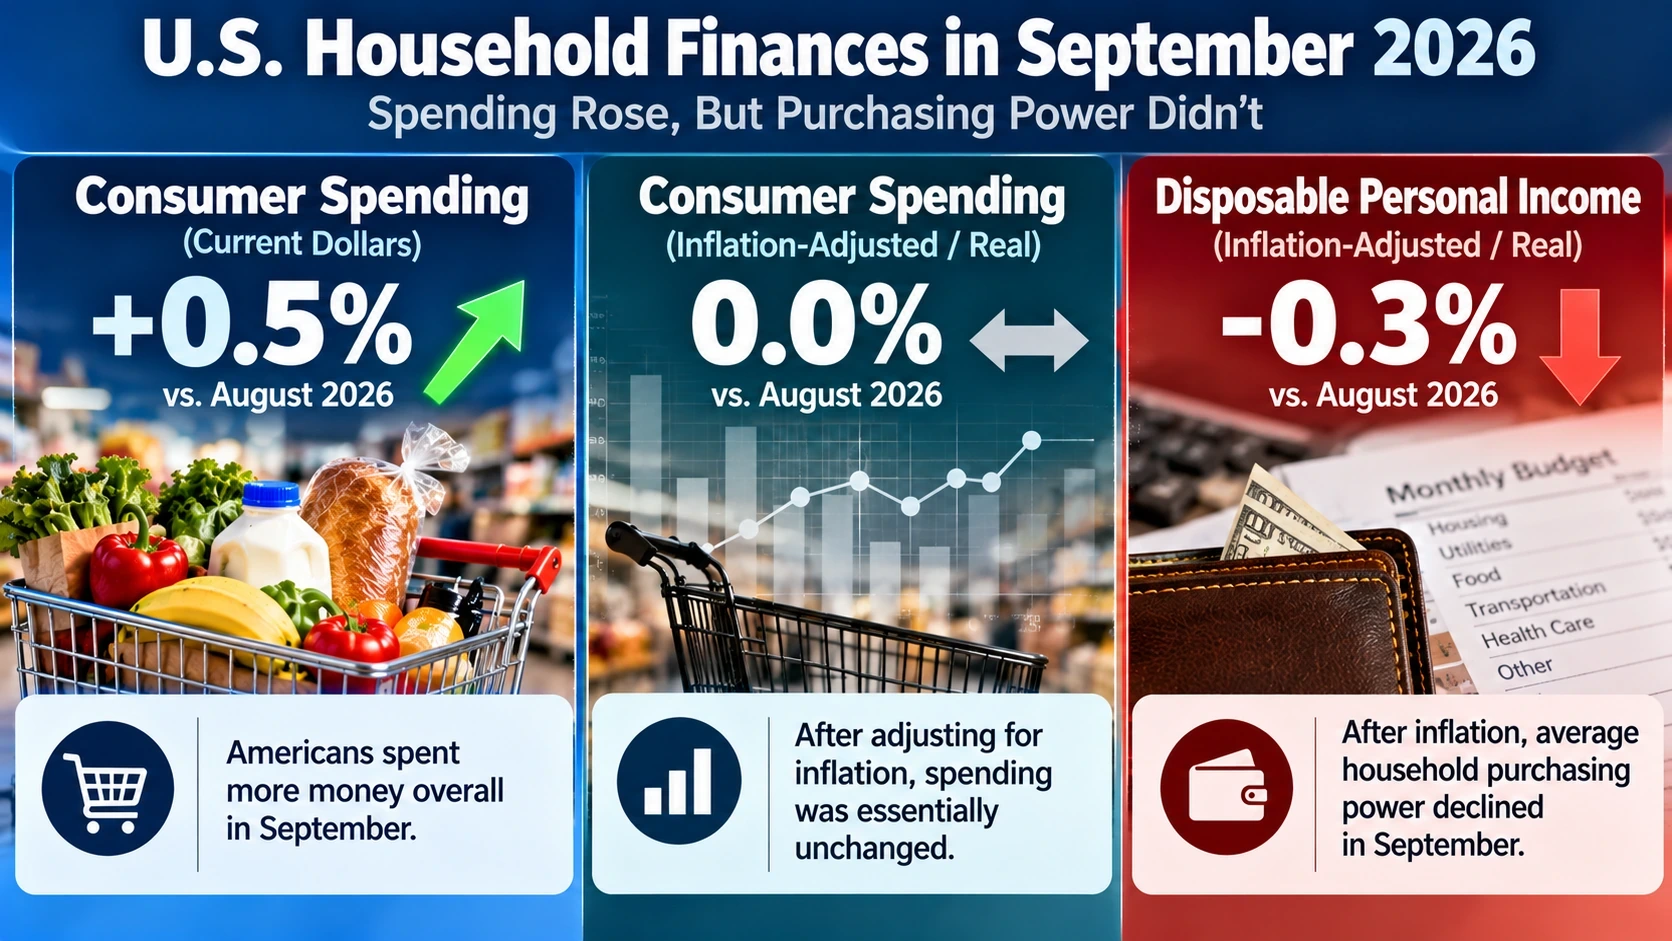
The latest income report offers a more direct explanation for why strong GDP growth may not feel like financial progress.
In September, Americans spent more money overall, but inflation-adjusted consumer spending was essentially unchanged. Real disposable personal income, which measures after-tax income adjusted for inflation, actually declined 0.3% from August. (Bureau of Economic Analysis)
Here is the difference:
| September 2026 measure | Monthly change | What it means |
|---|---|---|
| Consumer spending, current dollars | +0.5% | More dollars spent |
| Consumer spending, inflation-adjusted | 0.0% rounded | Essentially no increase in purchasing volume |
| Disposable income, inflation-adjusted | -0.3% | Reduced average purchasing power |
| PCE price index | +0.5% | Consumer prices increased |
These are national measures, not a description of every individual household.
Still, the comparison helps explain the disconnect.
If a family spends more at the supermarket because prices have increased, its total spending rises even if it buys the same amount of food.
The economy records the spending. The family experiences the higher bill.
And if income fails to keep up with prices, the household may need to reduce other purchases, use savings, or rely more on borrowing.
Are Americans Saving Less?
The national personal saving rate fell to 3.8% in September, compared with 4.0% in August, according to the BEA’s latest revised figures. (Bureau of Economic Analysis)
That does not mean every family is running out of savings. The saving rate is an economy-wide measure, and households have widely different financial circumstances.
But it adds another piece to the story: strong national spending does not necessarily imply growing financial breathing room.
What Was Actually Driving the Economy’s Strong Growth?
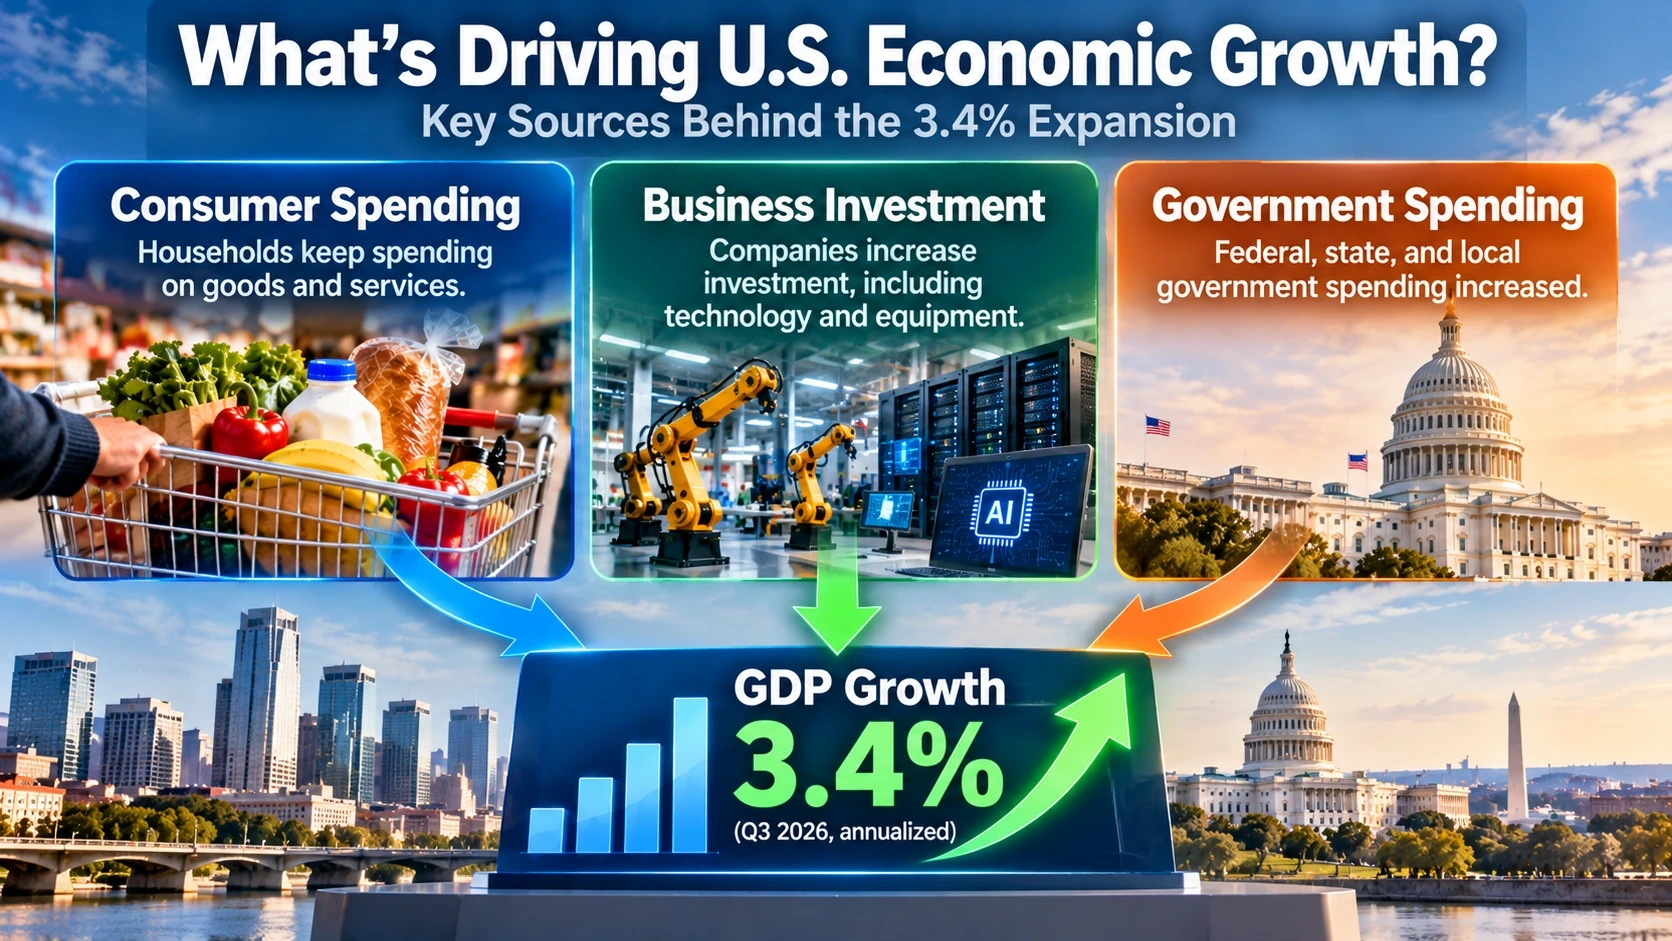
The third-quarter expansion came from several sources, particularly business investment and consumer spending, alongside an increase in government spending.
The BEA also reported that declining exports partly offset those gains. (Bureau of Economic Analysis)
An important part of the investment story involves technology.
Businesses have been purchasing equipment and expanding technology-related capabilities, including infrastructure associated with artificial intelligence.
AP reported that business investment outside housing increased strongly, while investment in information-processing equipment was particularly robust. Residential investment, by contrast, declined. (AP)
That combination helps explain why headlines about the economy can appear disconnected from ordinary experiences.
A company investing heavily in computer equipment contributes to GDP.
A household facing a higher electricity bill also contributes to economic activity when it pays for that service.
But the two experiences say very different things about financial well-being.
Does Strong Consumer Spending Mean Families Are Comfortable?
Not necessarily.
Consumer spending increased at a 3.8% annualized rate during the third quarter, an important source of overall growth. Yet September’s monthly inflation-adjusted spending was approximately flat. (AP · Bureau of Economic Analysis)
Those results are compatible because a quarterly growth rate and one month’s change measure different periods.
More importantly, people do not spend only when they feel financially secure.
Housing, health care, food, transportation, and utilities are expenses many households cannot easily avoid.
Spending can remain resilient even while financial pressure builds.
If Inflation Is Still High, Why Doesn’t the Federal Reserve Fix It Immediately?
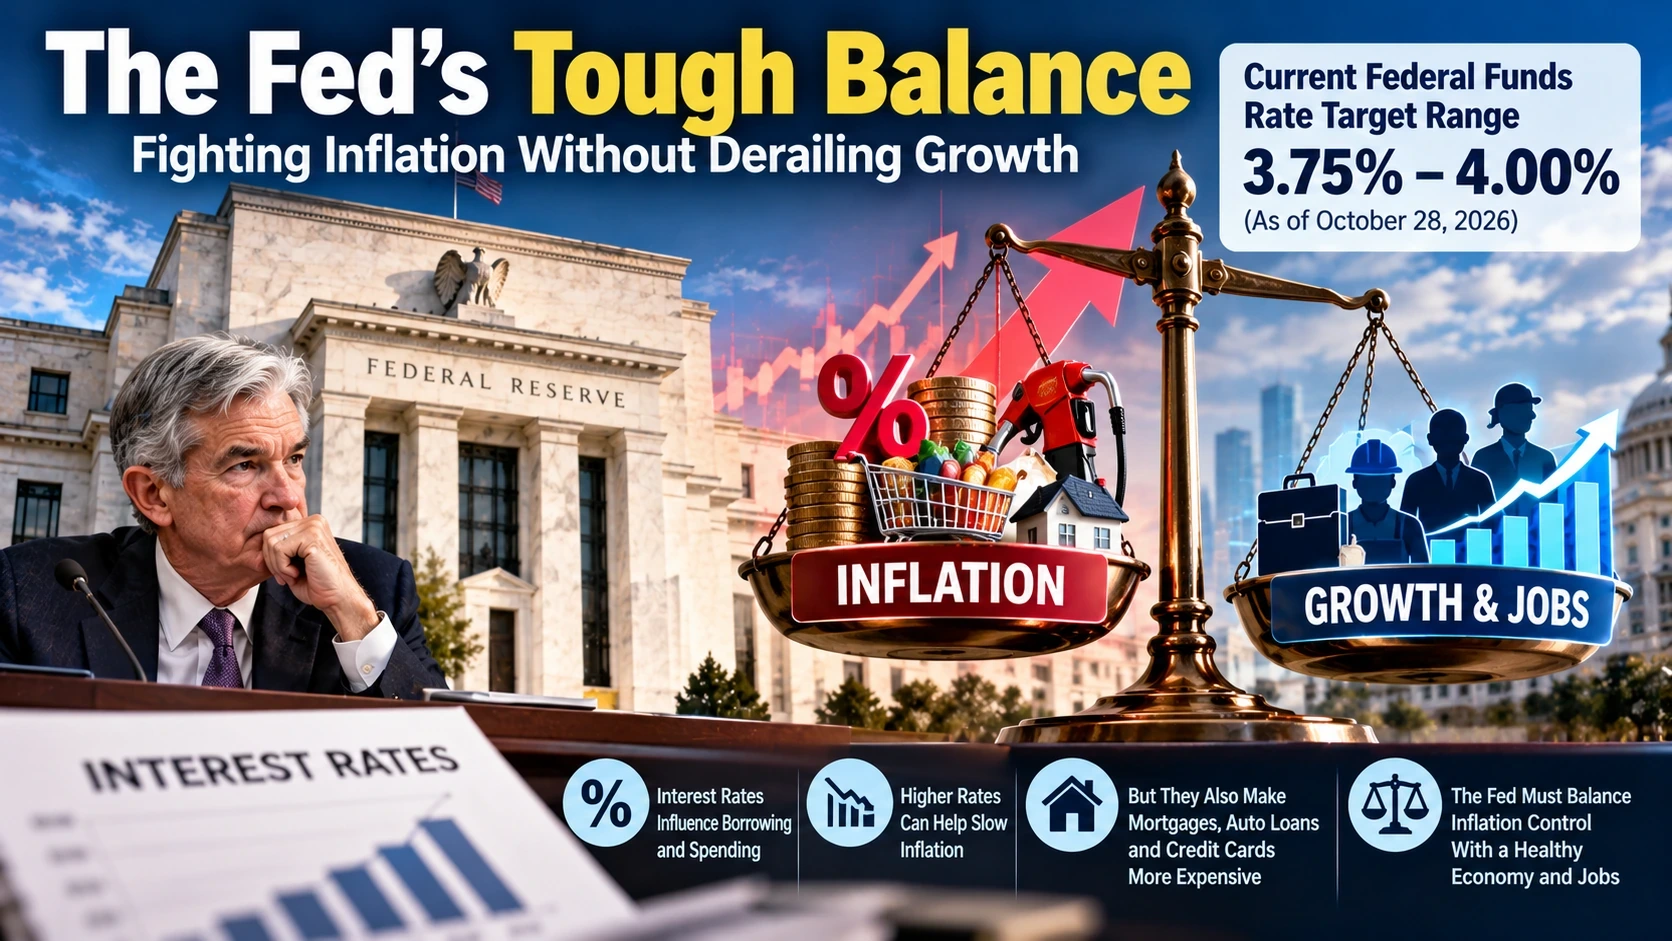
The Federal Reserve cannot simply order businesses to lower prices.
Its primary tool is monetary policy, particularly the interest rates that influence borrowing and spending throughout the economy.
Higher interest rates can help slow demand and reduce inflationary pressure, but they also make some forms of borrowing more expensive.
That can affect credit cards, auto loans, businesses seeking financing, and housing affordability. (Federal Reserve)
On October 28, one day before the GDP and inflation reports, the Federal Reserve held its benchmark interest-rate target range at 3.75% to 4.00%.
The decision was not unanimous. Two policymakers preferred an increase of 0.25 percentage point. (Federal Reserve: October 28 Statement)
This reflects the difficulty policymakers face.
Inflation is running above the Fed’s 2% goal, but the economy has also demonstrated substantial resilience.
Raising rates further could help reduce inflation. It could also discourage borrowing and investment, potentially slowing employment and growth.
Keeping rates unchanged avoids additional tightening for now, but does not guarantee that inflation will return quickly to target.
Strong GDP growth and high inflation can therefore give the Fed conflicting signals—not an easy answer.
The September PCE report adds pressure to that debate, but it does not determine the next interest-rate decision.
What Should Americans Watch Next?
The next economic reports will help show whether the gap between national growth and household purchasing power is narrowing.
Three indicators deserve particular attention.
First, inflation-adjusted income. If household income starts rising faster than prices, consumers may begin to experience more meaningful financial relief.
Second, consumer spending. The strength of spending during the third quarter was encouraging for overall GDP, but September’s flat real spending raises questions about how much momentum will continue into the final months of the year.
Third, inflation and Federal Reserve policy. If price pressures remain elevated, borrowing costs may stay restrictive or increase further. If inflation cools, policymakers could eventually have greater flexibility.
The BEA has scheduled its second estimate of third-quarter GDP and its October personal income and spending report for November 25, 2026. Those releases will provide updated information on growth, inflation, and household finances. (Bureau of Economic Analysis: GDP · Bureau of Economic Analysis: Personal Income)
For individuals, the most useful question is not simply whether GDP is growing.
It is whether income, essential expenses, savings, and borrowing costs are moving in a direction that makes everyday life more manageable.
Bottom Line: What This Story Really Means
The U.S. economy expanded at a strong 3.4% annualized rate in the third quarter of 2026, while annual PCE inflation reached 3.6% in September.
Those figures describe different things, so there is no contradiction.
Economic growth means the country is producing more goods and services. It does not guarantee rising purchasing power for every American.
September’s income data underscore that distinction: inflation-adjusted disposable income fell 0.3%, while real consumer spending was essentially unchanged.
That is why the economy can appear healthy in national statistics while household budgets remain under pressure.
A stronger economy is not automatically the same thing as a more affordable life.
The more meaningful sign of improvement for households will come when purchasing power strengthens and essential expenses become easier to manage—not merely when GDP posts another impressive number.
U.S. GDP Growth: Key Questions Explained
Q. How fast did the U.S. economy grow in the third quarter of 2026?
Real GDP grew at a 3.4% annualized rate, according to the advance estimate released October 29, 2026. The second-quarter rate was 2.2%.
Q. Does 3.4% GDP growth mean Americans earned 3.4% more?
No. GDP measures national economic production, not the growth of individual paychecks or household income.
Q. What was the U.S. PCE inflation rate in September 2026?
The PCE price index increased 3.6% over the preceding 12 months, up from 3.4% in August. The September monthly increase was 0.5%.
Q. Why can GDP growth and inflation both be high?
Because they measure different aspects of the economy. GDP tracks production, while inflation tracks changes in consumer prices. Economic activity can grow even as the prices consumers pay continue rising.
Q. Did Americans’ purchasing power improve in September?
Not according to the national real disposable income measure. Inflation-adjusted disposable personal income fell 0.3% from August, although individual households experienced different outcomes.
Q. Did Americans actually buy more in September?
Inflation-adjusted consumer spending was essentially unchanged from August, even though nominal spending rose 0.5%. Much of the increase in dollars spent reflected higher prices rather than a meaningful increase in the volume of purchases.
Q. What is the difference between PCE inflation and GDP growth?
GDP growth describes changes in the economy’s inflation-adjusted production. PCE inflation describes changes in consumer prices. Their percentages should not be treated as interchangeable.
Q. Did the Federal Reserve raise interest rates in October 2026?
No. At its October 28 meeting, the Fed maintained its benchmark rate target range at 3.75% to 4.00%, although two policymakers preferred an increase.
Q. When will the next major U.S. GDP and PCE reports be released?
The BEA has scheduled the second estimate of third-quarter GDP and the October personal income and spending report for November 25, 2026.
Did this help make the story clearer? 🙂
WIN keeps unpacking the “why” behind the news—clearly and simply!
Sources
Economic Growth and GDP Components
Bureau of Economic Analysis — GDP Advance Estimate, Third Quarter 2026
AP — U.S. Economy Grows at Brisk 3.4% Pace in Third Quarter
Inflation, Income, and Consumer Purchasing Power
Bureau of Economic Analysis — Personal Income and Outlays, September 2026
Bureau of Economic Analysis — Disposable Personal Income
Bureau of Economic Analysis — Personal Saving Rate
Reuters — U.S. Inflation Heats Up in September; Consumer Spending Rises
Federal Reserve Policy and Interest Rates
Federal Reserve — October 28, 2026 FOMC Statement
Federal Reserve — Why Do Interest Rates Matter?
Keep Reading
Could Rising Business Costs Push Household Prices Even Higher?
GDP growth measures the economy’s output, but prices can also be affected by what companies pay for energy, transportation, and other business expenses. A recent producer-inflation report helps explain how those costs may eventually reach consumers.
Why Did U.S. Wholesale Prices Jump 1.3%—and Could Your Bills Rise Next?
How Do Federal Reserve Rate Increases Affect Everyday Borrowing?
The October inflation figures raise new questions about the Fed’s next move. Its September rate increase offers useful background on why monetary policy can influence mortgages, credit cards, and savings differently.
Why Did the Fed Raise Rates Again—and What Does It Mean for Mortgages, Credit Cards, and Savings?